
2018–19 Departmental Results Report
Analysis of Trends in Spending and Human Resources
Actual Expenditures
Departmental Spending Trend Graph
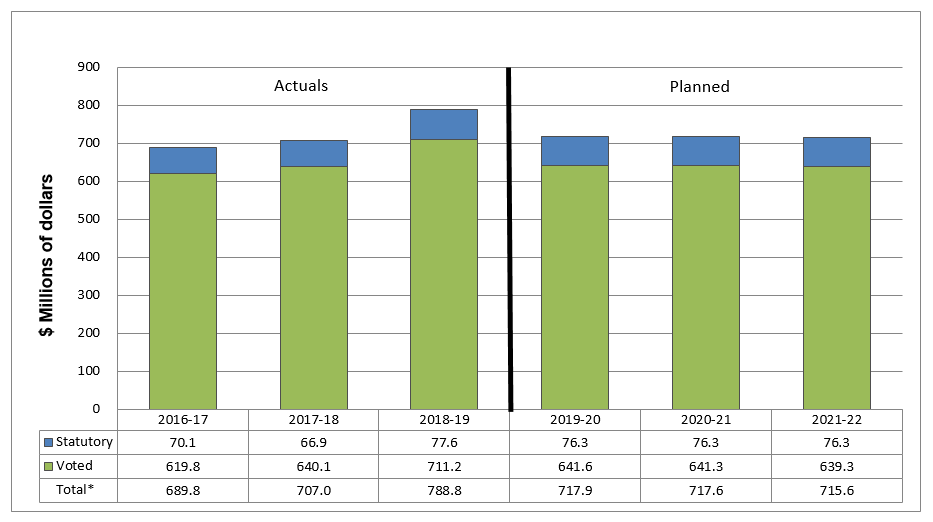
Text Version: Departmental Spending Trend Graph
This stacked vertical bar graph represents departmental spending trends for six fiscal years for the Department of Justice Canada. The graph presents a timeline (in fiscal years) on the horizontal axis and amount of dollars (in millions of dollars) on the vertical axis. The timeline on the horizontal axis shows six vertical bars; one for each fiscal year from 2016-17 on the left through to 2021-22.
The amount of millions of dollars on the vertical axis ranges from 0 to 900. Each vertical bar displays an accumulated total of departmental spending for two categories: Statutory and Voted Spending. These two categories are also displayed numerically below each bar to indicate the precise dollar amount for each funding and the total for the combined amounttable note i for the six fiscal years presented.
The first vertical bar of the timeline, representing fiscal year 2016-17, displays $70.1 million for statutory, $619.8 million for voted for a total of $689.8 million.
The second bar of the timeline, representing fiscal year 2017-18, displays $66.9 million for statutory, $640.1 million for voted for a total of $707.0 million.
The third bar of the timeline, representing fiscal year 2018-19, displays $77.6 million for statutory, $711.2 million for voted for a total of $788.8 million.
The fourth bar of the timeline, representing fiscal year 2019-20, displays $76.3 million for statutory, 641.6 million for voted for a total of $717.9 million.
The fifth bar of the timeline, representing fiscal year 2020-21, displays $76.3 million for statutory, $641.3 for voted for a total of $717.6 million.
The sixth and final bar of the timeline, representing fiscal year 2021-22, displays $76.3 million for statutory, $649.3 for voted for a total of $715.6 million.
| Core Responsibilities and Internal Services | 2018–19 Main Estimates | 2018–19 Planned spending | 2019–20 Planned spending | 2020–21 Planned spending | 2018–19 Total authorities available for use | 2018–19 Actual spending (authorities used) | 2017–18 Actual spending (authorities used) | 2016–17 Actual spending (authorities used) |
|---|---|---|---|---|---|---|---|---|
| Legal Services | 184,853,562 | 184,853,562 | 194,853,652 | 194,920,797 | 244,330,076 | 243,874,771 | 180,732,263 | 186,457,240 |
| Justice System Support | 437,758,882 | 437,758,882 | 444,923,893 | 445,030,079 | 460,369,523 | 448,180,851 | 430,621,197 | 416,312,567 |
| Subtotal | 622,612,444 | 622,612,444 | 639,777,545 | 639,950,876 | 704,699,599 | 692,055,622 | 611,353,460 | 602,769,807 |
| Internal Services | 75,132,559 | 75,132,559 | 78,105,514 | 77,676,082 | 98,410,946 | 96,751,723 | 95,648,611 | 87,049,639 |
| Total | 697,745,003 | 697,745,003 | 717,883,059 | 717,626,958 | 803,110,545 | 788,807,345 | 707,002,071 | 689,819,446 |
In 2018-19, Main Estimates totaled $697.7 million and the total authorities available amounted to $803.1 million. The total authorities available include $5.4 million of funding received through the 2018-19 Supplementary Estimates processes and $99.9 million of funding from Treasury Board Central Votes such as Compensation Adjustments, Operating Budget Carry Forward and Budget Implementation, and other small adjustments.
The $14.3 million variance between the total authorities available of $803.1 million and the actual spending of $788.8 million is mostly explained by unspent Grants and Contributions funding.Footnote 1
The Department’s total actual spending of $788.8 million represents an 11.6% increase compared to 2017-18 ($707.0 million). This increase is primarily explained by the retroactive compensation payments and salary increases from various collective agreements that were signed and ratified in 2018-19 and by an increase in spending on Grants and Contributions specifically for the one-time funding to address demand for Immigration and Refugee Legal Aid.
| Core Responsibilities and Internal Services | 2018–19 Actual gross spending | 2018–19 Actual gross spending for specified purpose accounts | 2018–19 Actual revenues netted against expenditures | 2018–19 Actual net spending (authorities used) |
|---|---|---|---|---|
| Legal Services | 523,191,854 | 0 | 279,317,083 | 243,874,771 |
| Justice System Support | 448,180,851 | 0 | 0 | 448,180,851 |
| Subtotal | 971,372,705 | 0 | 279,317,083 | 692,055,622 |
| Internal Services | 147,550,253 | 0 | 50,798,530 | 96,751,723 |
| Total | 1,118,922,958 | 0 | 330,115,613 | 788,807,345 |
As the primary provider of legal services to federal government departments and agencies, the Department of Justice has a Vote-Netted Revenue Authority to collect respendable revenue. For the purpose of departmental reporting, Vote-Netted Revenue is the total amount of expenditures reduced by the revenues received by the Department.
| 2016-17 Actual | 2017-18 Actual | 2018-19 Planned | 2018-19 Actual | 2019-20 Plannedtable note i | 2020-21 Plannedtable note i | |
|---|---|---|---|---|---|---|
| Vote-Netted Revenue | 306.3 | 316.3 | 296.2 | 330.1 | 327.0 | 327.0 |
In 2018-19, $330.1 million of Vote-Netted Revenue was collected, an increase of $13.8 million compared to 2017-18. This increase is primarily due to a 2.0% increase to legal service rates in 2018-19 to account for salary adjustments due to the ratification of various collective agreements. In addition, this increase is due to increased litigation for a broad variety of client departments and agency files, as well as legal services to support the Canada Revenue Agency’s commitment to reduce tax evasion and combat tax avoidance.
Actual Human Resources
| Core Responsibilities and Internal Services | 2016–17 Actual full time equivalents | 2017–18 Actual full time equivalents | 2018–19 Planned full time equivalents | 2018–19 Actual full time equivalents | 2019–20 Planned full time equivalents | 2020–21 Planned full time equivalents |
|---|---|---|---|---|---|---|
| Legal Services | 3,047 | 3,044 | 3,039 | 3,122 | 3,130 | 3,130 |
| Justice System Support | 298 | 296 | 289 | 291 | 296 | 296 |
| Subtotal | 3,345 | 3,340 | 3,328 | 3,413 | 3,426 | 3,426 |
| Internal Services | 966 | 971 | 985 | 973 | 974 | 974 |
| Total | 4,311 | 4,311 | 4,313 | 4,386 | 4,400 | 4,400 |
Expenditures by Vote
For information on the Department of Justice’s, organizational voted and statutory expenditures, consult the Public Accounts of Canada 2018–2019.
Government of Canada Spending and Activities
Information on the alignment of the Department of Justice’s spending with the Government of Canada’s spending and activities is available in the GC InfoBase.
Financial Statements and Financial Statements Highlights
Financial Statements
The financial highlights presented within this document are intended to serve as a general overview of the Department’s Statement of Operations and Statement of Financial Position as presented in the Departmental Financial Statements (unaudited). These statements are prepared in accordance with accrual accounting principles and are therefore different from reporting on the use of authorities, as reflected in previous sections of this report. Reconciliation between authorities used and the net cost of operations is set out in Note 3 of the departmental financial statements (unaudited). The Department’s financial statements (unaudited) for the year ended March 31, 2019, are available on the departmental website.
Financial Statements Highlights
The financial results are reported by the Department’s core responsibilities and associated internal services. The two core responsibilities aim to ensure a fair, relevant and accessible Canadian justice system and a federal government that is supported by high-quality legal services.
| Financial information | 2018–19 Planned results | 2018–19 Actual results | 2017–18 Actual results | Difference (2018–19 Actual results minus 2018–19 Planned results) | Difference (2018–19 Actual results minus 2017–18 Actual results) |
|---|---|---|---|---|---|
| Total expenses | 1,068,855,000 | 1,207,153,970 | 1,103,876,745 | 138,298,970 | 103,277,225 |
| Total revenues | 296,200,000 | 330,556,030 | 316,307,501 | 34,356,030 | 14,248,529 |
| Net cost of operations before government funding and transfers | 772,655,000 | 876,597,940 | 787,569,244 | 103,942,940 | 89,028,696 |
Planned Results
Planned Results are based on the Future-Oriented Financial Statements presented in the 2018-19 Departmental Plan. The actual expenses for 2018-19 were $138.3 million higher than planned expenses mainly due to the following: retroactive compensation payments and in-year increments related to the ratification of various collective agreements; overpayments related to Phoenix pay system implementation, an increase in transfer payments related to cost-shared agreements such as Criminal Legal Aid and Immigration and Refugee Legal Aid; and new funding received for Access to Justice in Official Languages and Vulnerable Victims and the modernization of IT infrastructure.
The actual revenues for 2018-19 are $34.4 million higher than planned revenues. This is mostly explained by the increase in the legal services rates for 2018-19, as approved by Treasury Board, which included anticipated increased costs for the Law Practitioner (LP) group collective agreement, and by the change in the funding model for some initiatives, which resulted in increased cost recovery from clients.
Expenses
Total departmental expenses were $1.2 billion in 2018-2019, which represents an increase of $103.3 million from 2017-18. The variance is mainly explained by the following factors:
- An increase in salaries and employee benefits due to retroactive compensation payments and in-year compensation increases, primarily related to the ratification of various collective agreements;
- An increase in transfer payment expenses related to contributions to assist in the operation of Criminal Legal Aid and Immigration and Refugee Legal Aid as well as new funding for Access to Justice in Official Languages and Vulnerable Victims;
- An increase in purchases of IT and office equipment.
Expenses by Program Activity
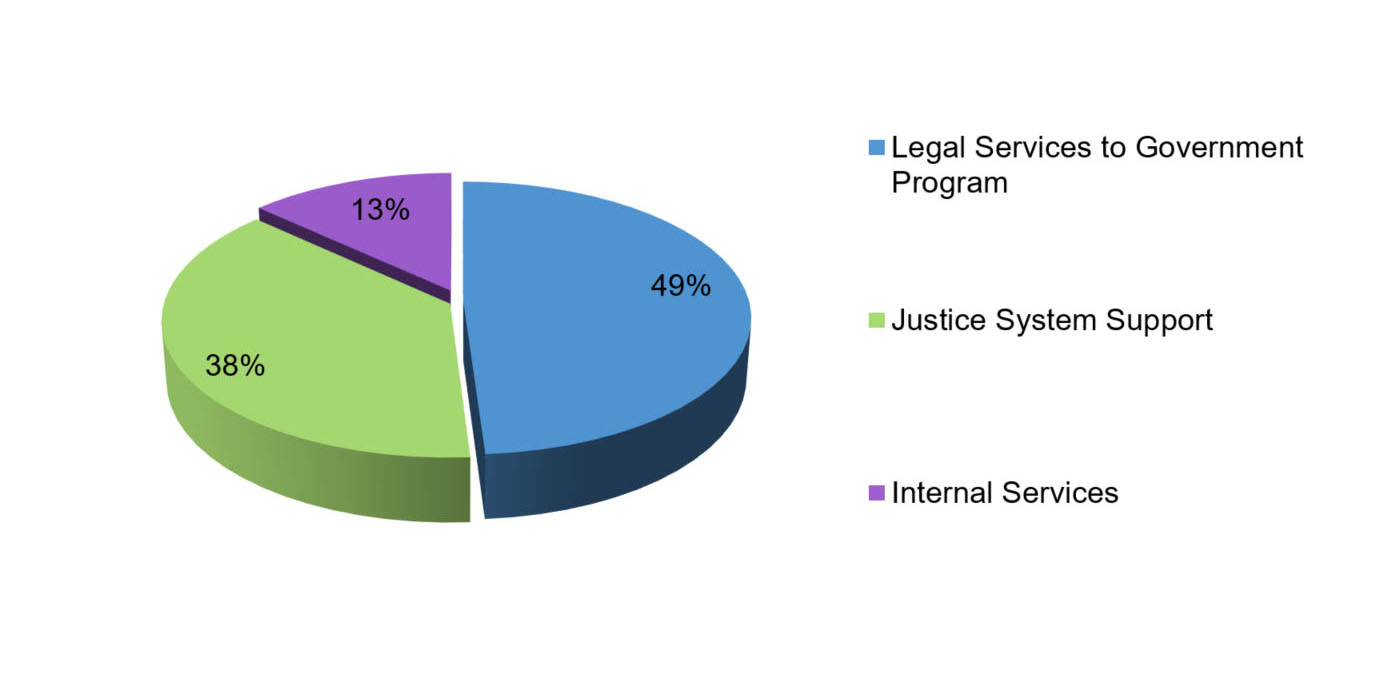
Text Version: Expenses by Program Activity
The pie chart of Expenses by Program shows the largest portion of expenses, representing 49% of the pie, falling under the Legal Services to Government Program. The wedge containing 38% of expenses is labelled Justice System Support, whereas the Internal Services Program comprises 13% of the pie.Revenues
Total departmental revenues were $330.6 million in 2018-19, a net increase of $14.2 million from 2017-18. This variance is mainly explained by increases to the legal services rates and increased litigation for a broad variety of files across client departments and agencies.
Revenues by type
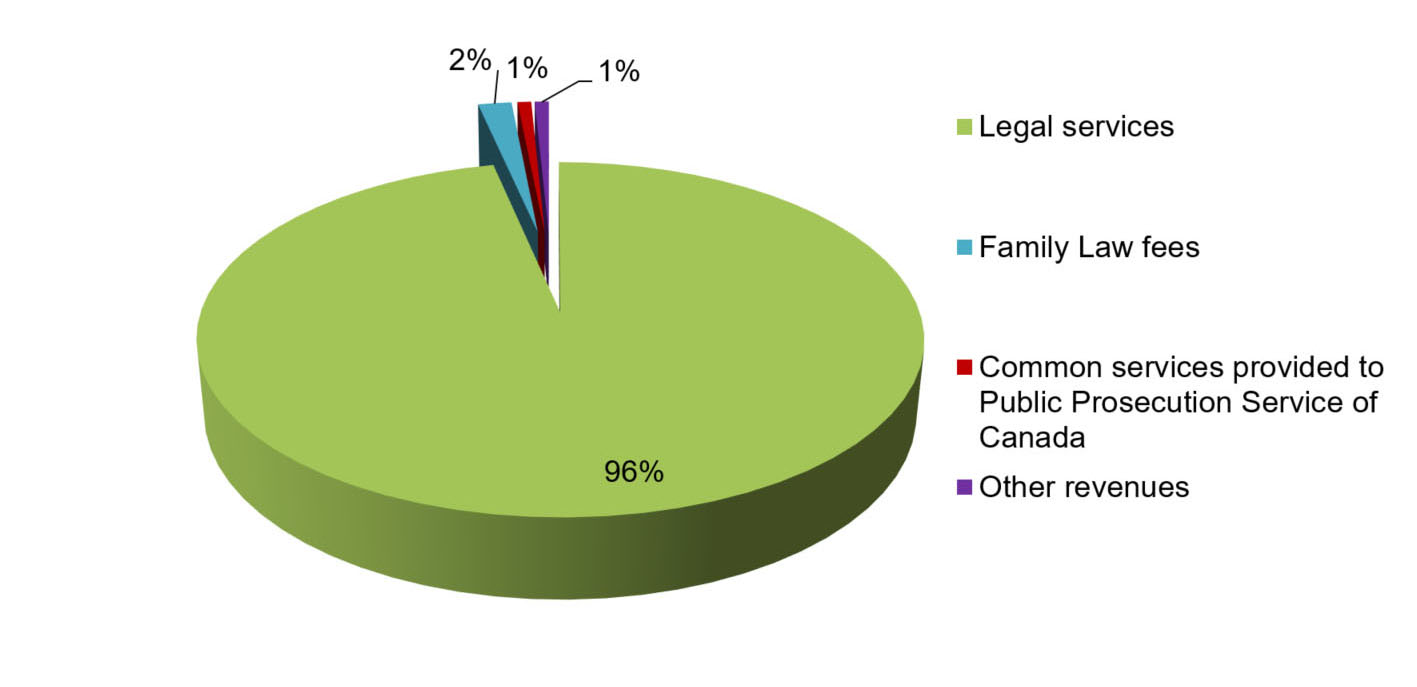
Text Version: Revenues by type
This pie chart portrays revenues by type. The largest section, Legal Services, represents 96% of the pie. Family Law fees account for 2%. Also referenced is 1% in Other Revenues and 1% in Common Services.| Financial Information | 2018–19 | 2017–18 | Difference (2018–19 minus 2017–18) |
|---|---|---|---|
| Total net liabilities | 445,936,949 | 423,513,912 | 22,423,037 |
| Total net financial assets | 407,182,504 | 385,368,082 | 21,814,422 |
| Departmental net debt | 38,754,445 | 38,145,830 | 608,615 |
| Total non-financial assets | 44,079,979 | 38,904,143 | 5,175,836 |
| Departmental net financial position | 5,325,534 | 758,313 | 4,567,221 |
The departmental net financial position increased by $4.6M, primarily due to the capitalization of leasehold improvements and software development.
- Date modified: