
Spending and Human Resources
Spending 2019–20 to 2024–25
The following graph presents actual and planned spending over time.
Spending and Human Resources - Departmental Spending Trend Graph – Text version
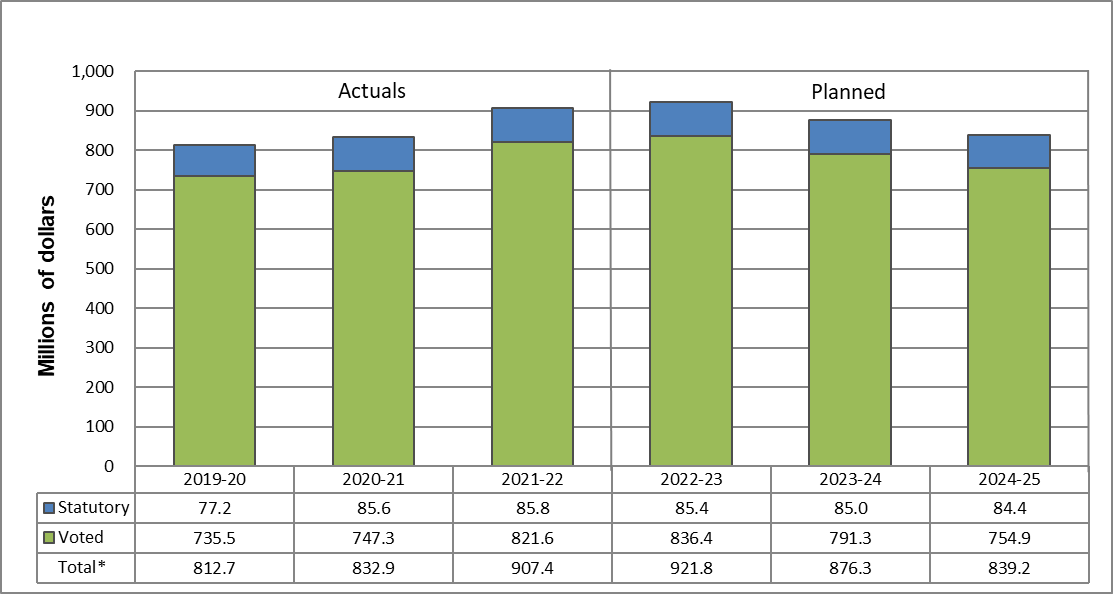
This stacked column graph represents departmental spending trends for six fiscal years for the Department of Justice Canada. The graph presents a timeline (in fiscal years) on the horizontal axis and the amount of dollars (in millions of dollars) on the vertical axis. The timeline on the horizontal axis shows six columns; one for each fiscal year from 2019-20 on the left through to 2024-25. The columns for fiscal years 2019-20 to 2021-22 show actual spending, while the columns for fiscal years 2022-23 to 2024-25 show planned spending.
The amount of millions of dollars on the vertical axis ranges from 0 on the bottom to 1,000 on the top. Each column displays an accumulated total of departmental spending for two categories of funding: statutory and voted. These two categories of funding are also displayed numerically below each column to indicate the precise amount of spending (in millions of dollars) for each of the six fiscal years presented.
The first column of the timeline, representing fiscal year 2019-20, displays $77.2 million in statutory spending and $735.5 million in voted spending, for a total actual spending of $812.7 million.
The second column of the timeline, representing fiscal year 2020-21, displays $85.6 million in statutory spending and $747.3 million in voted spending, for a total actual spending of $832.9 million.
The third column of the timeline, representing fiscal year 2021-22, displays $85.8 million in statutory spending and $821.6 million in voted spending, for a total actual spending of $907.4 million.
The fourth column of the timeline, representing fiscal year 2022-23, displays $85.4 million in statutory spending and $836.4 million in voted spending, for a total planned spending of $921.8 million.
The fifth column of the timeline, representing fiscal year 2023-24, displays $85.0 million in statutory spending and $791.3 million in voted spending, for a total planned spending of $876.3 million.
The sixth and final column of the timeline, representing fiscal year 2024-5, displays $84.4 million in statutory spending and $754.9 million in voted spending, for a total planned spending of $839.2 million.
As illustrated in the graph above, the Department’s actual spending shows an increasing trend. Actual spending in 2021-22 ($907.4 million) represents a $74.5 million (9.0%) increase compared to 2020-21 ($832.9 million).
The $74.5 million increase in spending from 2020-21 to 2021-22 was mainly due to:
- an increase in Grants and Contributions spendingFootnote 37 resulting from new investments as announced in the Fall Economic Statement 2020 and Budget 2021, with the most significant increases being under the following programs:
- an increase in salary expenditures as a result of an increase in workforce and compensation adjustments.
The Department’s planned spending projects a decrease from 2022-23 ($921.8 million) to 2024-25 ($839.2 million). This $82.6 million overall reduction is mainly attributable to the end of temporary funding for various initiatives under the Justice System Support core responsibility.
Budgetary Performance Summary for Core Responsibilities and Internal Services (dollars)
The following table presents the budgetary financial resources allocated for the Department of Justice Canada’s core responsibilities and for internal services.
| Core responsibilities and internal services | 2021–22 Main Estimates |
2021–22 planned spending |
2022–23 planned spending |
2023–24 planned spending |
2021–22 total authorities available for use |
2019–20 actual spending (authorities used) |
2020–21 actual spending (authorities used) |
2021–22 actual spending (authorities used) |
|---|---|---|---|---|---|---|---|---|
| Legal services | 218,606,709 | 218,606,709 | 219,037,730 | 218,414,091 | 229,371,539 | 223,737,181 | 228,106,265 | 222,168,257 |
| Justice system support | 491,424,229 | 491,424,229 | 621,285,285 | 576,876,579 | 601,370,321 | 485,250,753 | 497,598,856 | 582,469,495 |
| Subtotal | 710,030,938 | 710,030,938 | 840,323,015 | 795,290,670 | 830,741,860 | 708,987,934 | 725,705,121 | 804,637,752 |
| Internal services | 84,439,375 | 84,439,375 | 81,434,060 | 81,031,518 | 108,914,576 | 103,733,100 | 107,148,024 | 102,779,851 |
| Total | 794,470,313 | 794,470,313 | 921,757,075 | 876,322,188 | 939,656,436 | 812,721,034 | 832,853,145 | 907,417,603 |
In 2021-22, the Main Estimates totalled $794.5 million and the total authorities available for use amounted to $939.7 million. The total authorities available for use included $111.4 million of funding received through the Supplementary Estimates processes ($102.6 million for grants and contributions programs) and $32.5 million of funding received in relation to the operating budget carrying forward of prior year authorities, compensation adjustments, and other expenditures.
2021–22 Budgetary Actual Gross Spending Summary (dollars)
The following table reconciles gross planned spending with net spending for 2021–22.
| Core responsibilities and internal services | 2021–22 actual gross spending |
2021–22 actual revenues netted against expenditures |
2021–22 actual net spending (authorities used) |
|---|---|---|---|
| Legal services | 561,140,691 | 338,972,434 | 222,168,257 |
| Justice system support | 582,469,495 | 0 | 582,469,495 |
| Subtotal | 1,143,610,186 | 338,972,434 | 804,637,752 |
| Internal services | 157,075,838 | 54,295,987 | 102,779,851 |
| Total | 1,300,686,024 | 393,268,421 | 907,417,603 |
Vote-Netted Revenue (dollars)
As the primary provider of legal services to federal government departments and agencies, the Department of Justice Canada has Vote-Netted Revenue (VNR) authority to collect respendable revenue. For the purpose of departmental reporting, the total amount of expenditures are reduced by the revenues received by the Department.
| Vote-netted Revenue | 2019-20 actual |
2020-21 actual |
2021-22 plannedFootnote * of Table |
2021-22 actual |
2022-23 plannedFootnote ** of Table |
2023-24 plannedFootnote ** of Table |
|---|---|---|---|---|---|---|
| Total | 345,233,102 | 360,097,042 | 366,800,000 | 393,268,421 | 366,800,000 | 366,800,000 |
Voted-Netted Revenue (dollars) Graph – Text version
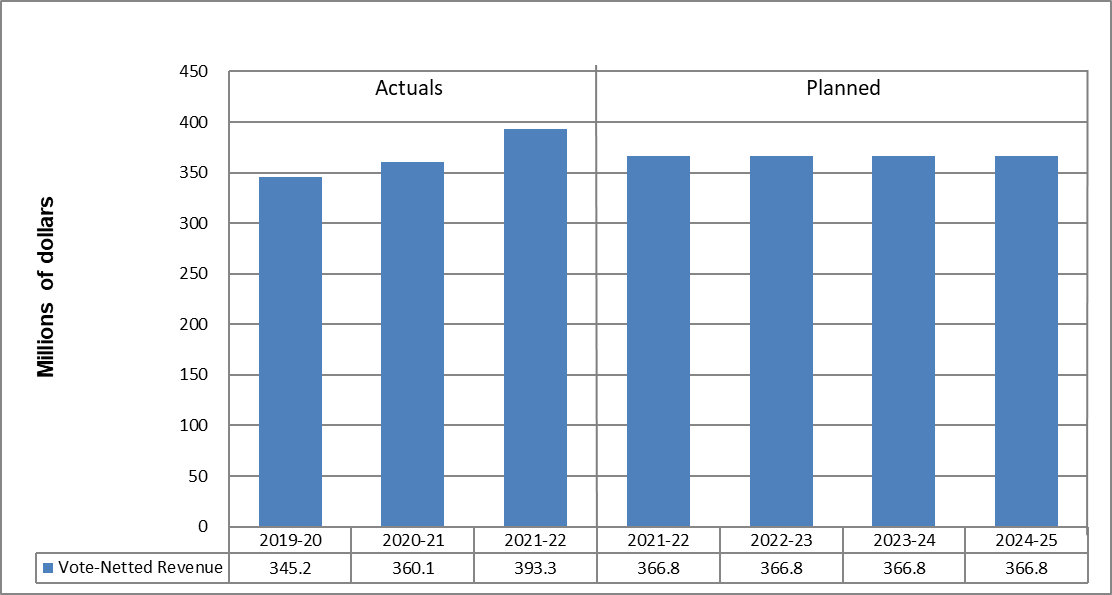
This stacked column graph represents departmental revenue trends for six fiscal years for the Department of Justice Canada. The graph presents a timeline (in fiscal years) on the horizontal axis and the amount of dollars (in millions of dollars) on the vertical axis. The timeline on the horizontal axis shows seven columns; the first three columns are the actual revenues with one column for each fiscal year from 2019-20 to 2021-22 and the next four columns present the planned revenue with one column for each fiscal year from 2021-22 through to 2024-25.
The amount of millions of dollars on the vertical axis ranges from 0 on the bottom to 450 on the top. Each column displays the voted-netted total of departmental revenue. The totals of revenue are also displayed numerically below each column to indicate the precise amount of revenue (in millions of dollars) for each of the six fiscal years presented.
The first column of the timeline, representing fiscal year 2019-20, displays $345.2 million in actual vote-netted revenue.
The second column of the timeline, representing fiscal year 2020-21, displays $360.1 million in actual vote-netted revenue.
The third column of the timeline, representing fiscal year 2021-22, displays $393.3 million in actual vote-netted revenue.
The fourth column of the timeline, representing fiscal year 2021-22, displays $366.8 million in planned vote-netted revenue.
The fifth column of the timeline, representing fiscal year 2022-23, displays $366.8 million in planned vote-netted revenue.
The sixth column of the timeline, representing fiscal year 2023-24, displays $366.8 million in planned vote-netted revenue.
The seventh and final column of the timeline, representing fiscal year 2024-25, displays $366.8 million in planned vote-netted revenue.
In 2021-22, $393.3 million of VNR was collected, an increase of $33.2 million compared to 2020-21 ($360.1 million). This increase was primarily due to the following:
- an increase in demand for legal services from client departments and agencies in such areas as tax and immigration matters and
- increases in the workforce and in the legal services rates.
Human Resources
The following table presents the full-time equivalents (FTEs) allocated to each of the Department of Justice Canada’s core responsibilities and to internal services.
Human resources summary for core responsibilities and internal services
| Core responsibilities and internal services | 2019–20 actual full-time equivalents |
2020–21 actual full-time equivalents |
2021–22 planned full-time equivalents |
2021–22 actual full-time equivalents |
2022–23 planned full-time equivalents |
2023–24 planned full-time equivalents |
|---|---|---|---|---|---|---|
| Legal services | 3,243 | 3,361 | 3,370 | 3,477 | 3,535 | 3,535 |
| Justice system support | 284 | 308 | 308 | 332 | 342 | 342 |
| Subtotal | 3,527 | 3,669 | 3,678 | 3,809 | 3,877 | 3,877 |
| Internal services | 1,043 | 1,053 | 1,042 | 1,091 | 1,094 | 1,094 |
| Total | 4,570 | 4,722 | 4,720 | 4,900 | 4,971 | 4,971 |
The table above shows an increasing trend in human resources. The actual FTEs increased by 178 from 2020-21 (4,722) to 2021-22 (4,900). The most significant increase is an additional 116 FTEs in the Legal Services core responsibility, where demand for legal services has increased over the years and is projected to increase in the future.
Expenditures by Vote
For information on the Department of Justice Canada’s organizational voted and statutory expenditures, consult the Public Accounts of Canada 2021.
Government of Canada Spending and Activities
Information on the alignment of the Department of Justice Canada’s spending with the Government of Canada’s spending and activities is available in GC InfoBase.
Financial Statements and Financial Statements Highlights
Financial Statements
The Department of Justice Canada’s Financial Statements (unaudited) for the year ended March 31, 2022, are available on the departmental website. The financial highlights presented within this document are intended to serve as a general overview of the Department’s Statement of Operations and Statement of Financial Position as presented in the 2021-22 Departmental Financial Statements (unaudited). These statements are prepared in accordance with accrual accounting principles and are therefore different from reporting on the use of authorities as reflected in previous sections of this report. Reconciliation between authorities used and the net cost of operations is set out in note 3 of the 2021-22 Departmental Financial Statements (unaudited).
Financial Statement Highlights
The financial results are driven by delivering on the Department’s core responsibilities and associated internal services. The two core responsibilities aim to ensure a fair, relevant and accessible Canadian justice system and a federal government that is supported by high-quality legal services.
Condensed Statement of Operations (unaudited) for the year ended March 31, 2022 (dollars)
| Financial information | 2021–22 planned results |
2021–22 actual results |
2020–21 actual results |
Difference (2021–22 actual results minus 2021–22 planned results) |
Difference (2021–22 actual results minus 2020–21 actual results) |
|---|---|---|---|---|---|
| Total expenses | 1,255,500,000 | 1,386,298,722 | 1,303,274,100 | 130,798,722 | 83,024,622 |
| Total revenues | 366,800,000 | 393,228,029 | 360,079,897 | 26,428,029 | 33,148,132 |
| Net cost of operations before government funding and transfers | 888,700,000 | 993,070,693 | 943,194,203 | 104,370,693 | 49,876,490 |
Planned Results
Planned Results are based on the Future-Oriented Financial Statements presented in the 2021-22 Departmental Plan. The actual expenses for 2021-22 were $130.8 million higher than planned expenses, mainly due to the following:
- increased expenses related to new funding received during the year, mainly for the Youth Justice Services Funding Program and Immigration and Refugee Legal Aid transfer payment programs; and
- increased personnel expenses for increased workforce, parental benefits and other entitlements upon cessation of employment, payments for damages due to the Phoenix pay system, retroactive compensation payments, and in-year increments related to the ratification of collective agreements.
The actual revenues for 2021-22 are $26.4 million higher than planned revenues. This is mainly attributable to an increase in the provision of legal services to a broad range of clients and the increase in legal services rates during the year.
Expenses
Total departmental expenses were $1.3 billion in 2021-22, which represents an increase of $83.0 million from 2020-21. The variance is explained by increases in the following accounts:
- expenses for cost-shared programs with provinces and territories, namely the Youth Justice Services Funding Program and Criminal Legal Aid Program; and
- salary expenses and employee benefits related to an increase in the workforce and yearly compensation adjustments due to the ratification of various collective agreements.
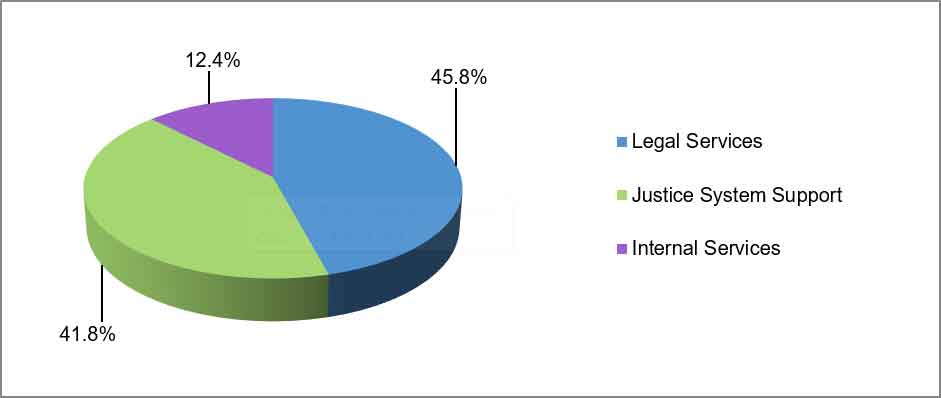
Expenses by Core Responsibility 2021-22 – Text version
The pie chart shows the largest portion of expenses, representing 45.8% of the pie, falling under the Legal Services core responsibility. The Justice System Support core responsibility expenses represent 41.8% of the pie, and the Internal Services expenses comprise 12.4% of the pie.
Revenues
Total departmental revenues were $393.2 million in 2021-22, a net increase of $33.1 million from 2020-21. This variance is mainly explained by an increase in legal services revenues resulting from increased demand, supported by an increase in the workforce, and an increase in the legal services rates during the year.

Revenues by Type – Text version
This pie chart displays revenues by type. The largest section, Legal Services, represents 97.5% of the pie. Family Law Fees account for 1.6% of the pie. Also shown is 0.6% in Common Services provided to the Public Prosecution Service of Canada and 0.3% in Other Revenues.
Condensed Statement of Financial Position (unaudited) as of March 31, 2022 (dollars)
| Financial information | 2021–22 | 2020–21 | Difference (2021–22 minus 2020–21) |
|---|---|---|---|
| Total net liabilities | 541,043,087 | 437,373,880 | 103,669,207 |
| Total net financial assets | 487,256,126 | 377,154,865 | 110,101,261 |
| Departmental net debt | 53,786,961 | 60,219,015 | (6,432,054) |
| Total non-financial assets | 27,669,302 | 32,741,192 | (5,071,890) |
| Departmental net financial position | (26,117,659) | (27,477,823) | 1,360,164 |
From 2020-21 to 2021-22, the Departmental Net Financial Position has increased by $1.4 million due to a number of factors, which are reflected in the information presented below.
The 2021–22 planned results information is provided in the Department of Justice Canada’s Future-Oriented Statement of Operations and Notes 2021–22.
Liabilities
The Department’s total net liabilities were $541.0 million at the end of 2021-22, which represents an increase of $103.7 million from 2020-21. The variance is mainly explained by increases in transfer payments payable due to timing of payments, particularly for payables related to additional funding received as announced in the Fall Economic Statement 2020 and Budget 2021 initiatives, such as:
- Improving Access to Justice for Indigenous People, including victims, offenders and families;
- Advancing a National Action Plan to End Gender-Based Violence;
- Diverting Youth Away from the Justice System;
- Enhancing Legal Support for Vulnerable Communities; and
- Funding for Gladue Principles - Systemic and Community-led Responses to Address Overrepresentation of Indigenous People in the Criminal Justice System.

Liabilities by Type – Text version
This pie chart displays liabilities by type. The largest section, Transfer Payments Payable, represents 71.1% of the pie. Accounts Payable and Accrued Liabilities account for 15.2%. Vacation Pay and Compensatory Leave account for 10.0%, while Employee Future Benefits account for 3.2%. Lastly, the Family Law Account represents 0.5% of the liabilities.
Financial and Non-Financial Assets
Total net financial assets and non-financial assets were $514.9 million at the end of 2021-22, which represents an increase of $105.0 million from 2020-21. The variance is mainly explained by increases in amounts due from the Consolidated Revenue Fund (CRF), because of expenses incurred but not paid from the CRF and revenue recognized but not yet collected and/or deposited to the CRF by March 31, 2022. The due from CRF amount is the net of total cumulative payables and receivables at year end, and represents the balance of cash that Justice can access from the CRF without charging departmental authorities.

Assets by Type – Text version
This pie chart displays assets by type. The largest section, Due from the Consolidated Revenue Fund, represents 88.5% of the pie. Receivables and Advances account for 6.1%, whereas Tangible Capital Assets account for 5.4%. Lastly, Prepaid Expenses represent less than 0.1% of assets.
- Date modified: