
Evaluation of the Youth Justice Initiative Funding Components
APPENDIX B: Tables
| 2005–2006 | 2006–2007 | 2007–2008 | 2008–2009 | |
|---|---|---|---|---|
| Actual spending | $185,302,415 | $177,302,415 | $177,302,415 | $177,302,415 |
| Planned spending | $144,750,000 | $144,750,000 | $177,302,415 | $177,302,415 |
| Total authorities | $185,302,415 | $177,302,415 | $177,302,415 | $177,302,415 |
| Variance | $40,552,415 | $32,552,415 | $0 | $0 |
Source: Department of Justice DPRs 2005-2006 to 2008-2009
Notes:
- 2005–2006: An amount of $32,552,415 in additional money already earmarked in the fiscal framework for this program was accessed during the year as well as an additional amount of $8M.
- 2006–2007: Additional funding was obtained through Supplementary Estimates.
| 2005–2006 | 2006–2007 | 2007–2008 | 2008–2009 | |
|---|---|---|---|---|
| Actual spending | $2,885,475 | $3,424,450 | $4,039,250 | $9,028,126 |
| Planned spending | $11,325,250 | $6,903,500 | $11,048,000 | $11,048,000 |
| Total authorities | $2,899,100 | $3,903,500 | $6,949,487 | $10,629,441 |
| Variance | $8,439,775 | $3,479,050 | $7,008,750 | $2,019,874 |
Source: Department of Justice DPRs 2005-2006 to 2008-2009
Notes:
- 2005–2006: The number of IRCS orders imposed by the courts was much lower than initially anticipated.
- 2006–2007: The number of IRCS sentences was much lower than was anticipated when the program was developed and, as a result, annual spending was significantly below planned levels. Treasury Board has approved the use of $3M to offset other departmental requirements.
- 2007–2008: Ongoing supplementary funding of $11M approved at First Supplementary Estimates minus Reallocation of $10.2M; only $4M was spent. The number of IRCS sentences imposed by the courts remained much lower than initially anticipated, leading to actual spending lower than anticipated.
- 2008–2009: While the number of IRCS orders issued by the courts remained stable, funding requests for other exceptional cases under this program came more slowly than expected.
| 2005–2006 | 2006–2007 | 2007–2008 | 2008–2009 | |
|---|---|---|---|---|
| Actual spending | $4,417,002 | $3,670,563 | $2,935,467 | $3,189,765 |
| Planned spending | $4,585,000 | $3,280,000 | $3,905,000 | $5,005,000 |
| Total authorities | $5,980,000 | $5,005,000 | ||
| Variance | $167,998 | ($390,563) | $969,533 | $1,815,235 |
Source: Department of Justice DPRs for 2005-2006 to 2008-2009
Notes:
- Shading denotes that no information is available.
- YJF financial documentation differed from the DPR for 2006–2007 and indicated that planned spending equalled $5,980,000, in which case the variance would be $2,309,437 instead of ($390,563).
- 2006–2007: An additional $2.5M were received under the Fund through Supplementary Estimates for youth involved in Guns, Gangs, and Drugs. A portion of these funds was unspent, as resources were approved in the fall of 2006. In addition, $200,000 was returned to the Fund due to a reallocation of an earlier funding cut to another Justice program.
- 2007–2008: There was a transfer of $101,223 in grant funding and $71,000 in contribution funding from the GGD stream to the Core Fund.
- 2008–2009: Funding criteria were established, posted on the Internet, and sent to provincial/territorial representatives. A number of proposals submitted did not meet program criteria or required extensive development work, which resulted in lapsing funds. Also, uptake on the new funds allocated for drug treatment as part of the YJADS initiative was slow. Once this issue was identified by management, a request was made in September 2008 to re-profile some of the YJADS funding. However, the requests were not approved.
Figure 1: Sampling strategy for the survey of YJF funding recipients
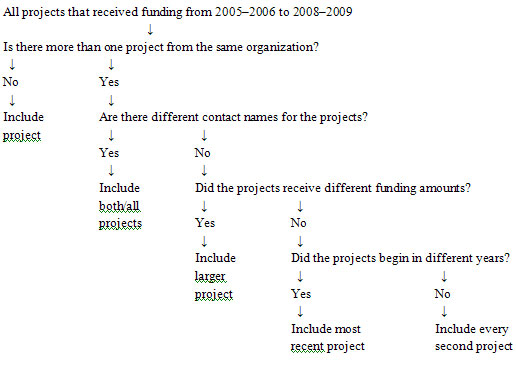
Text version
All projects that received funding from 2005-2006 to 2008-2009.
Is there more than one project from the same organization?
If no, include project.
If yes, are there different contact names for the projects?
If yes, include both / all projects.
If no, did the projects receive different funding amounts?
If yes, include the larger project.
If no, did the projects begin in different years?
If yes, include the most recent project.
If no, include every second project.
| Jurisdiction | Funding | 2005-2006 | 2006-2007 | 2007-2008 | 2008-2009 |
|---|---|---|---|---|---|
| Newfoundland and Labrador | Total | 18,809,744 | 19,106,633 | 19,506,573 | 19,669,055 |
| Federal | 5,349,960 | 5,119,000 | 5,119,000 | 5,119,000 | |
| % federal | 28% | 27% | 26% | 26% | |
| Prince Edward Island | Total | 4,511,412 | 4,462,192 | 4,684,000 | |
| Federal | 2,112,174 | 2,020,974 | 2,020,974 | ||
| % federal | 47% | 45% | 43% | ||
| Nova Scotia | Total | 15,315,330 | 16,603,978 | 18,323,054 | |
| Federal | 6,448,276 | 6,169,876 | 6,169,876 | 6,196,876 | |
| % federal | 40% | 37% | 34% | ||
| New-Brunswick | Total | 15,226,933 | 15,308,407 | 16,737,064 | |
| Federal | 5,040,054 | 4,822,454 | 4,822,454 | 4,822,454 | |
| % federal | 32% | 32% | 29% | ||
| Quebec | Total | --- | --- | --- | |
| Federal | 38,338,019 | ||||
| % federal | |||||
| Ontario | Total | 280,647,353 | 284,061,191 | 298,015,416 | 312,517,586 |
| Federal | 66,687,875 | 63,808,755 | 63,808,755 | 63,808,755 | |
| % federal | 24% | 22% | 21% | 20% | |
| Manitoba | Total | 28,965,364 | 32,344,713 | 36,882,126 | 43,062,584 |
| Federal | 6,722,770 | 6,432,530 | 6,432,530 | 6,432,530 | |
| % federal | 23% | 20% | 17% | 15% | |
| Saskatchewan | Total | 49,954,954 | 50,441,682 | 60,519,325 | 56,604,000* |
| Federal | 7,750,666 | 7,416,026 | 7,416,026 | ||
| % federal | 16% | 15% | 12% | ||
| Alberta | Total | 39,099,399 | 44,224,578 | ||
| Federal | 17,721,600 | 16,956,560 | 16,956560 | 16,956,560 | |
| % federal | 43% | 38% | |||
| British Columbia | Total | 73,446,833 | 71,300,000 | 73,512,097 | 71,042,414 |
| Federal | 23,132,712 | 22,133,992 | 22,133,992 | ||
| % federal | 31% | 31% | 30% | ||
| Yukon | Total | 3,498,738 | 4,113,505 | ||
| Federal | 1,152,448 | 1,102,688 | 1,102,688 | 1,102,688 | |
| % federal | 32% | 27% | |||
| Northwest Territories | Total | 8,648,467 | 9,093,184 | 9,445,000* | |
| Federal | 3,197,732 | ||||
| % federal | |||||
| Nunavut | Total | ||||
| Federal | 1,648,129 | ||||
| % federal |
Source: YJSFP financial documentation, supplemented with information from annual reports. Where annual reports are not available, the estimates for the fiscal year provided by the jurisdictions are used.
Notes:
- Shading denotes no information available
for this data source
- ---
= no agreement in place
- * Based on estimate of actual expenditures
| Jurisdiction | Federal funding 2006-2007 |
Number of youth accused 2006 | Federal funding per accused youth |
|---|---|---|---|
| Newfoundland and Labrador | $5,119,000 | 3,388 | $1,511 |
| Prince Edward Island | $2,020,974 | 1,108 | $1,824 |
| Nova Scotia | $6,169,876 | 7,987 | $772 |
| New-Brunswick | $4,822,454 | 4,807 | $1,003 |
| Quebec | --- | 21,888 | --- |
| Ontario | $63,808,755 | 60,616 | $1,053 |
| Manitoba | $6,432,530 | 11,384 | $565 |
| Saskatchewan | $7,416,026 | 17,728 | $418 |
| Alberta | $17,721,600* | 24,275 | $730 |
| British Columbia | $22,133,992 | 20,922 | $1,058 |
| Yukon | $1,052,688 | 689 | $1,528 |
| Northwest Territories | $3,197,732* | 1,873 | $1,707 |
| Nunavut | $1,648,129* | 1,200 | $1,373 |
Source: YJSFP financial documentation, Taylor-Butts & Bressan (2008, p. 13)
Note:
- Youth accused includes all youth charged
and youth cleared by other means
- ---
= no agreement in place
- * = 2005-2006 financial information used where no data available for 2006-2007 onwards
Table 6: YJF funding profile by fiscal year
| 2005–2006 | 2006–2007 | 2007–2008 | 2008–2009 | Total | |
|---|---|---|---|---|---|
| Funding | $4,484,832 | $11,694,022 | $2,342,251 | $2,576,491 | $21,097,596 |
| Projects | 78 | 100 | 34 | 32 | 244 |
| Average | $57,498 | $116,940 | $68,890 | $80,515 | $86,466 |
| 2005–2006 | 2006–2007 | 2007–2008 | 2008–2009 | Total | |
|---|---|---|---|---|---|
| Funding | $2,627,800 | $5,537,375 | $2,319,751 | $2,465,637 | $12,950,563 |
| Projects | 49 | 67 | 34 | 29 | 179 |
| Average | $53,629 | $82,647 | $68,228 | $85,022 | $72,350 |
| 2005–2006 | 2006–2007 | 2007–2008 | 2008–2009 | Total | |
|---|---|---|---|---|---|
| Funding | $1,857,032 | $6,156,647 | $0 | $110,854 | $8,124,533 |
| Projects | 29 | 33 | 0 | 3 | 65 |
| Win rate | 63% | 67% | 100% | 91% | 73% |
Source: GCIMS
Province/Territory |
Youth population 2006 (n=2,583,382) |
Applications to YJF (n=244) |
YJF-funded projects (n=179) |
Proportion of YJF funding (Total=$12,950,563) |
|---|---|---|---|---|
| % (n) |
% (n) |
% (n) |
% ($) |
|
| Newfoundland and Labrador | 1.5% (38,588) |
4.5% (11) |
5.6% (10) |
2.5% ($323,388) |
| Prince Edward Island | 0.5% (11,783) |
5.3% (13) |
6.7% (12) |
6.4% ($825,666) |
| Nova Scotia | 2.2% (71,871) |
7.8% (19) |
9.5% (17) |
5.3% ($691,608) |
| New Brunswick | 2.2% (57,009) |
4.5% (11) |
5.0% (9) |
2.2% ($290,489) |
| Quebec | 22.5% (581,355) |
6.6% (16) |
3.4% (6) |
1.4% ($175,570) |
| Ontario | 39.4% (1,017,730) |
34.0% (83) |
33.5% (60) |
47.3% ($6,122,796) |
| Manitoba | 4.0% (102,190) |
11.5% (28) |
10.6% (19) |
10.2% ($1,322,385) |
| Saskatchewan | 3.4% (3.4%) |
7.0% (17) |
6.1% (11) |
3.4% ($436,371) |
| Alberta | 10.8% (278,223) |
4.5% (11) |
5.6% (10) |
8.4% ($1,093,339) |
| British Columbia | 12.6% (324,977) |
12.3% (30) |
11.7% (21) |
12.0% ($1,557,323) |
| Yukon | 0.1% (2,697) |
0.8% (2) |
0.6% (1) |
0.7% ($90,876) |
| NWT | 0.2% (4,197) |
1.2% (3) |
1.7% (3) |
0.2% ($20,752) |
| Nunavut | 0.1% (3,851) |
--- | --- | --- |
Source: Statistics Canada (2009, November 30), GCIMS, youth population calculated from Taylor-Butts & Bressan (2008, p. 13)
Note:
--- = no applications submitted/no projects funded
Item |
Strongly agree | Agree | Disagree | Strongly disagree | Don’t know / no response |
|---|---|---|---|---|---|
| % (n) |
% (n) |
% (n) |
% (n) |
% (n) |
|
| a) The eligibility criteria for funding were clear | 30% (16) |
61% (33) |
4% (2) |
-- | 6% (3) |
| b) The proposal development process helped our organization to clarify the objectives of our project | 32% (17) |
50% (27) |
9% (5) |
2% (1) |
7% (4) |
| c) The proposal development process helped our organization to identify appropriate strategies for our project | 30% (16) |
44% (24) |
9% (5) |
-- | 17% (9) |
| d) Proposal requirements were clear | 33% (18) |
56% (30) |
4% (2) |
2% (1) |
6% (3) |
| e) The process for evaluating proposals was clear | 17% (9) |
54% (29) |
9% (5) |
-- | 20% (11) |
Note:
Row totals may not sum to 100% due to rounding.
Assistance |
Very useful | Useful | Not useful | N/A / Did not receive assistance | Don’t know / no response |
|---|---|---|---|---|---|
| % (n) |
% (n) |
% (n) |
% (n) |
% (n) |
|
| a) Information about the Youth Justice Fund | 43% (23) |
41% (22) |
-- | 4% (2) |
13% (7) |
| b) Assistance developing a proposal | 30% (16) |
33% (18) |
2% (1) |
20% (11) |
15% (8) |
| c) Feedback on a proposal | 33% (18) |
33% (18) |
-- | 19% (10) |
15% (8) |
| d) Technical support | 15% (8) |
13% (7) |
-- | 52% (28) |
20% (11) |
| e) Assistance with project management, including program delivery or administration | 9% (5) |
7% (4) |
4% (2) |
59% (32) |
20% (11) |
| f) Assistance with evaluation or performance measurement | 11% (6) |
22% (12) |
6% (3) |
46% (25) |
15% (8) |
| g) Assistance with reporting | 15% (8) |
30% (16) |
7% (4) |
33% (18) |
15% (8) |
Note:
Row totals may not sum to 100% due to rounding.
Item |
Strongly agree | Agree | Disagree | Strongly disagree | Don’t know |
|---|---|---|---|---|---|
| % (n) |
% (n) |
% (n) |
% (n) |
% (n) |
|
| a) Reporting requirements were clear | 35% (19) |
56% (30) |
2% (1) |
2% (1) |
6% (3) |
| b) Reporting requirements were reasonable | 30% (16) |
61% (33) |
2% (1) |
-- | 7% (4) |
| c) Youth Justice Fund staff clearly communicated expectations about reporting requirements | 33% (18) |
56% (30) |
2% (1) |
4% (2) |
6% (3) |
| d) Meeting reporting requirements was difficult | 6% (3) |
13% (7) |
63% (34) |
13% (7) |
6% (3) |
Note:
Row totals may not sum to 100% due to rounding.
Jurisdiction |
Expenditures | 2005–2006 | 2006–2007 | 2007–2008 | 2008–2009 |
|---|---|---|---|---|---|
| Newfoundland and Labrador | Minimum high | 7,136,402 | 6,828,109 | 6,828,109 | 6,828,109 |
| Actual high | 8,137,273 | 7,522,452 | 7,690,678 | 7,460,586* | |
| % difference | 14% | 10% | 13% | 9% | |
| % of total | 43% | 39% | 39% | 38% | |
| Prince Edward Island | Minimum high | 2,481,534 | 2,374,331 | 2,374,331 | 2,374,331 |
| Actual high | 2,539,630 | 2,567,690 | 2,696,000* | ||
| % difference | 2% | 8% | 14% | ||
| % of total | 56% | 58% | 58% | ||
| Nova Scotia | Minimum high | n/a | 7,007,594 | 7,007,594 | 7,007,594 |
| Actual high | 8,057,284 | 9,963,254 | 9,888,791 | ||
| % difference | 15% | 42% | 41% | ||
| % of total | 53% | 60% | 54% | ||
| New Brunswick | Minimum high | n/a | 5,772,930 | 5,772,930 | 5,772,930 |
| Actual high | 5,983,039 | 5,840,531 | 6,672,252 | ||
| % difference | 4% | 1% | 16% | ||
| % of total | 39% | 38% | 40% | ||
| Ontario | Minimum high | 94,267,380 | 90,196,350 | 90,196,350 | 90,196,350 |
| Actual high | 116,206,375 | 121,576,320 | 131,531,800 | 139,697,783 | |
| % difference | 23% | 35% | 46% | 55% | |
| % of total | 41% | 43% | 44% | 45% | |
| Manitoba | Minimum high | 10,603,062 | 10,075,785 | 10,075,785 | 10,075,785 |
| Actual high | 14,937,109 | 17,486,726 | 20,095,855 | 23,475,907* | |
| % difference | 42% | 74% | 99% | 133% | |
| % of total | 52% | 54% | 54% | 55% | |
| Saskatchewan | Minimum high | 15,419,552 | 14,753,427 | 14,753,427 | 14,753,427 |
| Actual high | 20,378,562 | 21,556,505 | 25,174,126 | 24,814,000* | |
| % difference | 32% | 46% | 71% | 68% | |
| % of total | 41% | 43% | 42% | 44% | |
| British Columbia | Minimum high | 41,363,789 | 36,806,653 | 36,806,653 | 36,806,653 |
| Actual high | 43,560,729 | 42,200,000 | 43,136,524 | 40,875,687 | |
| % difference | 5% | 15% | 17% | 11% | |
| % of total | 59% | 59% | 59% | 58% | |
| Yukon | Minimum high | 2,329,471 | 2,329,471 | 2,329,471 | |
| Actual high | 2,714,533 | 2,616,325 | 2,732,453 | ||
| % difference | 17% | 12% | 17% | ||
| % of total | 77% | 75% | 66% | ||
| Northwest Territories | Minimum high | 5,255,467 | 5,255,467 | 5,255,467 | 5,255,467 |
| Actual high | 5,953,925 | 6,653,109 | 6,962,377 | 7,445,000* | |
| % difference | 13% | 27% | 32% | 42% | |
| % of total | 74% | 77% | 77% | 79% | |
| Nunavut | Minimum high | ||||
| Actual high | |||||
| % difference | |||||
| % of total |
Source: YJSFP financial documentation supplemented with information from annual reports. In cases where YJSFP financial documentation differed from annual reports, annual report data were used. Where annual reports are not available, the estimates for the fiscal year provided by the jurisdictions were used.
Notes:
- Shading denotes no information available
for this data source.
- *Based on estimate of actual expenditures.
- Date modified: