
Exploring the Link between Crime and Socio-Economic Status in Ottawa and Saskatoon: A Small-Area Geographical Analysis
Figure 6.2 - Hight Crime Areas, Ottawa 2001 - Violent Offences (Top Quintile, n=237 Census DAs)
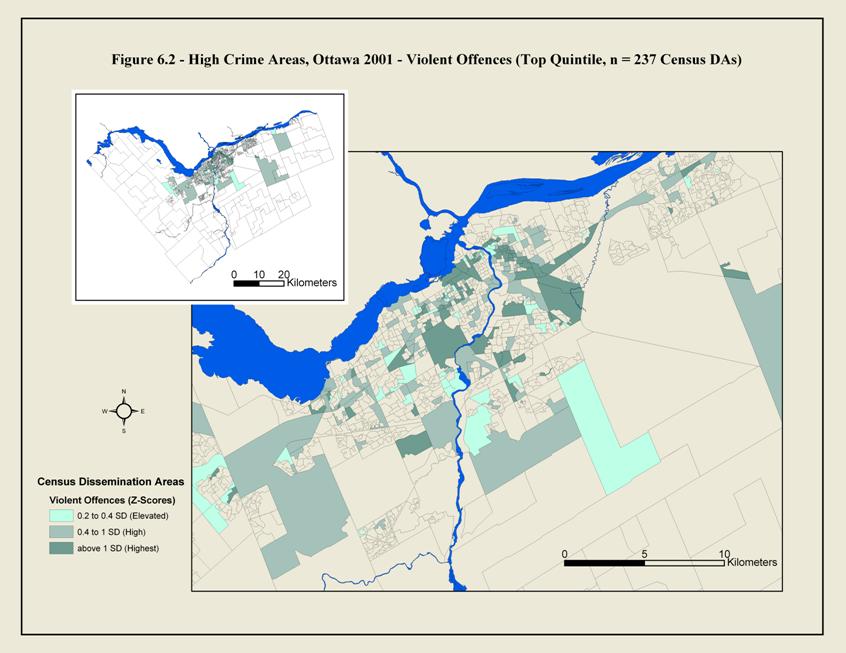
Text Version
The map shows census dissemination areas for areas in which there is an elevated risk of violent offences (0.2 to 0.4 SD), a high risk of violent offences (0.4 to 1 SD), and the highest risk of violent offences (Above 1 SD). Areas of an elevated risk of violent offences are represented by a light green, areas of a high risk of violent offences are represented by a medium green, and areas of the highest risk of violent offences are represented by a dark green.
The map demonstrates that the areas within the city core are areas the highest risk of violent crime, while areas with an elevated risk of violent crime are dispersed within the city and in the outskirts of the city.
- Date modified: