
Exploring the Link between Crime and Socio-Economic Status in Ottawa and Saskatoon: A Small-Area Geographical Analysis
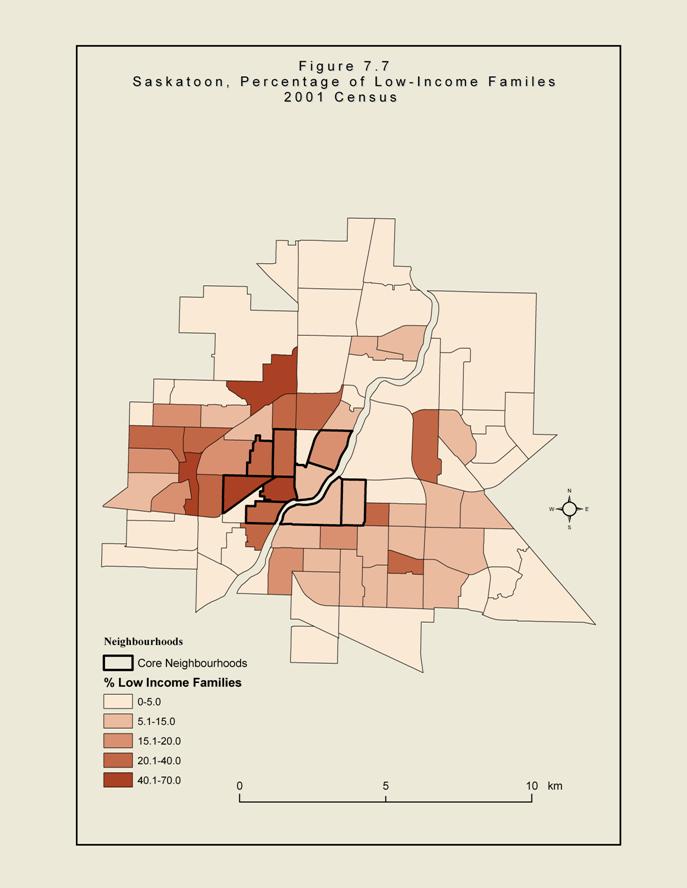
Figure 7.7 - Saskatoon, Percentage of Low-Income Families, 2001 Census
Text Version
The map shows the percentage of low-income families in each neighbourhood in Saskatoon in 2001. Neighbourhoods with the lowest percentage of low income families (0% to 5.0%) are highlighted by a peach colour, neighbourhoods with a low percentage of low income families (5.1% to 15.0%) are highlighted by pink, neighbourhoods with a moderate percentage of low income families (15.1% to 20.0%) are highlighted by a dark pink, neighbourhoods with a high percentage of low income families (20.1% to 40.0%) are highlighted by orange and neighbourhoods with the highest percentage of low income families (40.1 to 70.0%) are highlighted by red.
The map demonstrates that the areas with the highest rates of low income families are seen in the West side of the city and in and around the core area of the city.
- Date modified: