
Marriage and divorce trends in Canada, 1921 to 2020
June 2026
This fact sheet summarizes key data on marriage and divorce trends between 1921 and 2020, where available, from Statistics Canada’s Vital Statistics – Marriage Database and Divorce Database, the Census of Population, the Civil Court Survey and the Canadian Health Survey on Children and Youth. The year 2020 marks the first year of the COVID-19 pandemic during which public health measures were placed on provinces and territories.
The number of marriages in Canada steadily declined between the 1970s and 2020, reaching the lowest number recorded since 1938Footnote 1
The earliest publicly available marriage data in Canada is from 1921, when 71,254 marriages were performed. The number of marriages generally increased, before reaching a peak of 200,470 in 1972 (see Figure 1 below). The number then followed a gradual decline to 146,121 in 2019 and a sharp drop in 2020 to 98,355, the lowest number recorded since 1938. The crude marriage rate, which is the number of marriages per 1,000 population, fluctuated between 1921 and 1956, before increasing to 9.0 in 1972 and then steadily declining to 2.6 in 2020. The sharp decline in 2020, the first year of the COVID-19 pandemic, is likely due to public health measures across provinces and territories that restricted gatherings, imposed stay-at-home orders, and limited travel, disrupting the wedding plans of many couples.Footnote 2
The probability of ever marrying declined across all provinces and territories, falling from nearly three-quarters (74%) of Canadians in 1991 to less than half (44%) in 2020. Similarly, the proportion of people remarrying after divorce has declined, from representing 20% of newly married individuals in 1991 to 17% in 2020.Footnote 3
The number of marriages declined across all provinces and territories in 2020, the first year of the COVID-19 pandemic, with Quebec experiencing the largest drop (49%) and Saskatchewan experiencing the smallest (18%). Over the long term, Newfoundland and Labrador recorded the steepest decline in marriages, falling from 3,480 in 1991 to 1,098 in 2020, a decrease of 68%. This was followed by Quebec and New Brunswick, where the number of marriages declined from 28,923 and 4,521 in 1991 to 11,307 and 1,806 in 2020, marking decreases of 61% and 60%, respectively.
At the same time, the proportion of couples living in common-law unions increased significantly across all provinces and territories, rising from 6% in 1981 to 23% in 2021. This shift has been especially pronounced in Nunavut and Quebec, where common-law unions accounted for 52% and 43% of couples, respectively, in 2021. Correspondingly, marriage rates in both jurisdictions have remained consistently lower than in other provinces and territories over time, with marriage rates in Quebec declining from 4.1 per 1,000 population in 1991 to 1.3 in 2020, and in Nunavut from 2.9 in 1999 (when Nunavut officially became a territory) to 1.0 in 2020.
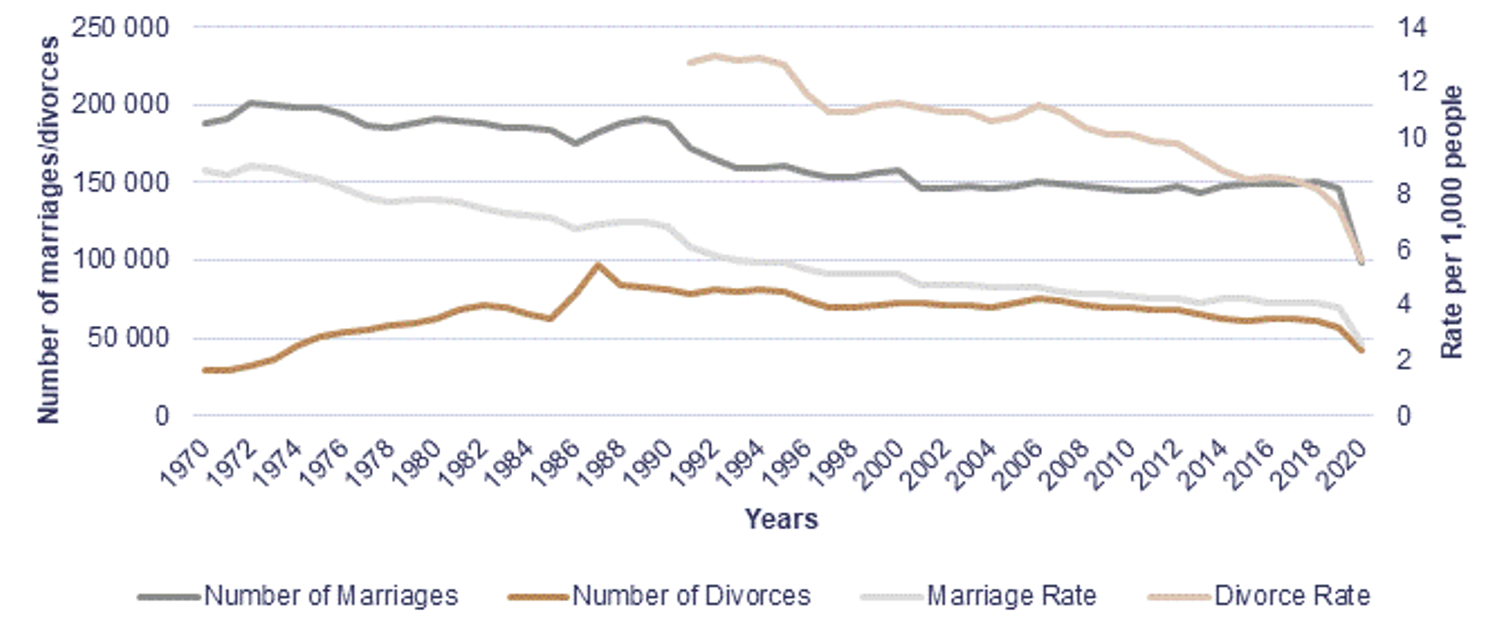
Figure 1. Number of marriages and divorces and marriage and divorce rates in Canada, 1970 to 2020
Text version
The line chart entitled “Number of marriages and divorces and marriage and divorce rates in Canada, 1970 to 2020” shows changes in both the number and rate per 1,000 people of marriages and divorces in Canada from 1970 to 2020. The horizontal axis represents years, while two vertical axes are used: the left axis shows counts of marriages and divorces (from 0 to 250,000), and the right axis shows rates (from 0 to 14 per 1,000 people). Four lines are plotted: Number of marriages, number of divorces, the marriage rate, and the divorce rate.
- The number of marriages begins at about 190,000 in 1970 then shows small fluctuations through the 1970s and 1980s, then gradually declines, dropping more noticeably during the 1990s. It then remains relatively stable at a lower level in the 2000s before declining again and falling sharply to just below 100,000 in 2020, marking the largest decrease.
- The number of divorces starts just below 30,000 in 1970 and increases steadily through the 1970s and early 1980s. The number peaks at over 97,000 in 1987 before declining gradually after the peak, with minor fluctuations through the 1990s, 2000s and 2010s before ending with a notable drop over 14,000 to just under 43,000 in 2020.
- The marriage rate (per 1,000 people) begins at 8.8 in 1970 then declines steadily over time, especially from the 1970s to early 1990s. It levels off somewhat in the late 1990s and 2000s then continues a slow decline to just under 4 by 2019, then dropping to 2.6 in 2020, representing a long-term, consistent downward trend.
- The divorce rate (per 1,000 people) starts at about 12.7 in 1991 before the highest value on the chart a year later in 1992 at 13. The number then declines steadily from the mid-1990s onward, dropping notably from 7.5 in 2019 to 5.6 in 2020, representing a shoring but still relatively consistent downward trend.
Note: Divorce rates before 1991 included people living in common-law unions in the estimates of married people. As such, only divorce rates as of 1991 are presented.
Source: Statistics Canada. 2022a. "I don't": Historic decline in new marriages during the first year of the pandemic. The Daily; and Statistics Canada. n.d.-c. Table 39-10-0051-01 – Number of divorces and divorce indicators.
The number of divorces in Canada peaked in the late 1980s and early 1990s before gradually declining to a 50-year low in 2020Footnote 4
The number of divorces in Canada peaked at 97,773 in 1987 following the 1986 Divorce Act reform, then gradually declined to a 50-year low in 2020. The 42,933 divorces recorded in 2020 represented a 25% drop from 2019 (56,937) and the lowest total since 1973. This decline occurred alongside a sharp decrease in marriages in 2020, likely due to broader pandemic-related disruptions to family formation and dissolution.
Divorce applications and granted divorces both fell sharply in the early months of the COVID-19 pandemic, with applications dropping from 5,586 in February 2020 to 1,743 in April 2020 and granted divorces decreasing from 4,743 in February 2020 to 1,983 in June 2020. All provinces saw declines in the number of divorces in 2020, with the sharpest decrease in Ontario (36%) and smaller drops in other provinces ranging from 11% (New Brunswick) to 22% (Alberta).
Divorce rates have declined across all age groups since the early 1990s, with the steepest decreases among younger adultsFootnote 5
The divorce rate (per 1,000 married persons) steadily decreased from 12.7 in 1991 (the earliest publicly available record) to 5.6 in 2020. There was a more pronounced decrease in the divorce rate among younger individuals. The rate among those aged 15 to 34 fell by 60%, from 21.2 per 1,000 married persons in 1991 to 8.5 in 2020 and the rate among those aged 35 to 49 dropped by 45% over the same period. In 2020, smaller declines were observed among older adults, with rates among those aged 50 to 64 decreasing by 10% and among those 65 and older by 20% from 1991. While overall divorce rates have fallen, divorces among individuals aged 50 and older – sometimes called “grey divorces” – rose by 26% between 1991 and 2006, increasing from 4.2 to 5.3 per 1,000 married persons. Since 2006, however, the “grey” divorce rate has remained relatively stable, aside from a temporary decrease in 2020 due to pandemic-related disruptions.
Divorce rates have declined equally for both men and women since 1990, with no significant gender gap over timeFootnote 6
In 1991, the divorce rate was 12.7 divorces per 1,000 married persons for both men and women. By 2017 (the most recent year for which divorce data are available by sex or gender), this rate had fallen to 8.4 for men and 8.6 for women, meaning that each of these genders followed nearly identical trajectories over the 27-year period. The lack of a gender gap is likely due in part to the larger proportion of different-gender couplesFootnote 7 (99% of all couples) and the similar proportion of male (51%) and female (49%) same-sex couples.Footnote 8
Both men and women are marrying and divorcing later in life than in the 1970sFootnote 9
Between 1970 and 2017 (the most recent gender-disaggregated data available), the average age at marriage and divorce rose steadily for both men and women. The average age at marriage increased from 25 to 31 years for men (+24%), and from 22 to 29 years for women (+32%), while the average age at divorce increased from 40 to 47 years for men (+18%) and from 37 to 45 years for women (+22%).
Alongside these shifts, the age at first marriage increased. Between 1991 and 1995, the average age at first marriage was 28 years. By 2020, the average age at first marriage had risen to 32 years, marking an increase of 14%.
Indigenous people and Black people are less likely to be married or in common-law unions and more likely to have never married compared to their White counterpartsFootnote 10
According to the 2021 Census, 59% of White people were married or living in common-law unions, compared to 45% of Indigenous people and 42% of Black people. The proportion who were married was highest among White people (44%), followed by Black people (35%) and Indigenous people (28%). However, when looking at common-law relationships, the differences between White (15%) and Indigenous people (17%) were less pronounced, while the proportion of Black people remained lower (7%). Divorce rates were similar for the three population groups: 7% among Black people, 7% among White people and 6% among Indigenous people. At the same time, Indigenous people (42%) and Black people (45%) were more likely to have never been married compared to White people (26%).
Almost one in five children have experienced parental separation or divorceFootnote 11
In 2019, 18% of children aged 1 to 17 (1,185,700 children) had experienced the separation or divorce of their parents. The proportion of children affected was higher in Quebec (23%) than the national average, while proportions in Ontario (16%), Manitoba (15%), and Alberta (16%) were lower. Older children aged 12 to 17 (24%) were the most likely to have experienced parental separation or divorce, compared with children aged 5 to 11 (19%) and children aged 1 to 4 (8%), coinciding with the declining divorce rate.
Divorce cases account for nearly half of all family court cases in CanadaFootnote 12
Not all relationship breakdowns result in court involvement. Some separating parties can resolve matters themselves or through family dispute resolution processes, while others rely on the court system to address unresolved issues. In 2019/2020, divorce cases accounted for nearly half (47%) of all active family court cases in Canada, representing 107,481 of 228,758 cases. Parenting time (previously known as custody and access) cases, support only cases, and other unknown family cases made up the remaining 53% of family court cases.
J4-198/2026E-PDF
ISBN 978-0-662-29574-7
- Date modified: