
Criminal court case indicators related to the Jordan timelines, 2016/2017 to 2023/2024
June 2026
On this page
- Introduction
- Methodology
- Findings
- Conclusion
- Annex I. Adult criminal court case indicators related to the Jordan limits, Canada, 2016/2017 to 2023/2024
- Annex II. Adult criminal court case indicators related to the Jordan limits, changes pre- and post-COVID-19, 2016/2017 to 2023/2024
- Annex III. Infosheet: Adult criminal court case indicators related to the Jordan timelines, 2016–2017 to 2023–2024
Introduction
In 2016, the Supreme Court of Canada released its R. v. Jordan decision, establishing presumptive ceilings beyond which delays in criminal court cases are considered unreasonable. Under this framework, the timelines for completing criminal cases are set out as follows: 18 months for cases tried in provincial court; and 30 months for cases tried in superior court or in provincial court following a preliminary inquiry. The Jordan decision allows for delays exceeding the presumptive ceiling to be justified on the basis of exceptional circumstances. Exceptional circumstances are those that are reasonably unforeseen or unavoidable and cannot be reasonably remedied once they arise.
While no national data exist on the number of cases being stayedFootnote 1 because of Jordan delays, Statistics Canada reports on several case time indicators related to Jordan timelines.Footnote 2 It should be noted that these indicators present important limitations (see footnotes 6 and 7) and are therefore considered proxy indicators as they are not a specific measure of Jordan delays.
Methodology
This research in brief summarizes the latest available data on three case time proxy indicators related to Jordan timelines (thereafter referred to as “Jordan proxies”) from Statistics Canada’s Integrated Criminal Courts Survey (ICCS). The ICCS collects information on appearances and charges in youth courts and adult criminal courts in Canada.Footnote 3 The three Jordan proxiesFootnote 4 examined in this Research in Brief pertain to adult criminal courts only, and include:
- median case time, which is the medianFootnote 5 number of calendar days from first appearance to final decision for cases requiring more than seven days to resolve;
- percentage of total cases potentially at risk of exceeding the Jordan timelines, based on the elapsed time between the first appearance in court and the final decision for the most serious offence (MSO; see Textbox 1) in the case;Footnote 6 and
- percentage of cases potentially at risk of exceeding the Jordan timelines that were also stayed or withdrawn.Footnote 7
Please note that offences classified under sex trade related offences—previously commonly referred to as “prostitution” offences (i.e. communicating to provide sexual services for consideration, stopping or impeding traffic for the purpose of offering, providing or obtaining sexual services for consideration)—were excluded from case time analyses.
When interpreting the findings presented below, it is important to consider the unprecedented challenges experienced by criminal courts in Canada in relation to the COVID-19 pandemic. The public health measures put in place to curb the spread of COVID-19 at the onset of the pandemic resulted in a substantial drop in the number of criminal cases completed in the courts.Footnote 8 Although the courts adopted temporary practices and utilized new technologies to advance cases despite significant capacity restrictions for traditional in-person activities, the circumstances did result in further court delays.
Textbox 1. Most Serious Offence (MSO) methodology
A case that has more than one charge is represented by the charge with the "most serious offence" (MSO). The most serious offence is selected using the following rules. First, court decisions are considered and the charge with the "most serious decision" (MSD) is selected. Court decisions for each charge in a case are ranked from most to least serious as follows: (1) guilty, (2) guilty of a lesser offence, (3) acquitted, (4) stay of proceeding, (5) withdrawn, dismissed or discharged, (6) not criminally responsible, (7) other, and (8) transfer of court jurisdiction. Second, in cases where two or more charges result in the same MSD (for example, guilty), Criminal Code sanctions are considered. The charge with the most serious offence type is selected according to an offence seriousness scale, based on actual sentences handed down by courts in Canada. (The offence seriousness scale is calculated using data from both the adult and youth components of the ICCS).
A case is considered potentially at risk of exceeding the Jordan timelines if the MSO has exceeded the presumptive ceilings for trial delays. In multiple charge cases, it is possible that some of the non-MSO charges were completed before the timelines were exceeded. For example, adult criminal court cases between 2019/2020 and 2023/2024 showed approximately 35% of multi-charge cases where the time required to complete the MSO was greater than timelines established in R. v. Jordan had one or more charges that were completed within the presumptive timelines.
Findings
Median number of days to complete adult criminal cases
The median case time to complete adult criminal court cases increased by 28% following the Jordan decision from 5.5 months to 7.1 months
The median number of days required to complete adult criminal court cases increased 28% from 169 days (5.5 months)Footnote 9 in 2016/2017, when the Jordan timelines came into effect, to 217 days (7.1 months) in 2023/2024.
Over this time period, the largest year-over-year increase was observed during the first year of the pandemic, rising 32% from 177 days (5.8 months) in 2019/2020 to 234 days (7.7 months) in 2020/2021. This remained as such (234 days) until decreasing 7% in 2023/2024 (217 days; 7.1 months). Nevertheless, the amount of time required to complete adult criminal cases in 2023/2024 remained greater than it was prior to the pandemic (217 days; 7.1 months in 2023/2024 vs. 177 days; 5.8 months in 2019/2020).
New Brunswick, the Northwest Territories and British Columbia recorded the biggest increases in median case time from 2016/2017 to 2023/2024Footnote 10
Increases in median case time were observed in all jurisdictions when comparing 2016/2017 to 2023/2024, with the biggest increases occurring in New Brunswick (+61%, from 154 days to 248 days), British Columbia (+59%, from 140 days to 223 days), the Northwest Territories (+59%, from 116 days to 184 days), Nova Scotia (+53%, from 206 days to 315 days) and Ontario (+52%, from 151 days to 229 days).Footnote 11 Only the Northwest Territories, New Brunswick, Newfoundland and Labrador and British Columbia recorded increases in median case time from 2022/2023 to 2023/2024. All other jurisdictions recorded decreases. The breakdown by jurisdictionFootnote 12 is as follows:
(increases from 2022/2023 to 2023/2024)
- Northwest Territories (+13%, from 163 days to 184 days)
- New Brunswick (+7%, from 231 days to 248 days)
- Newfoundland and Labrador (+2%, from 304 days to 310 days)
- British Columbia (+2%, from 219 days to 223 days)
(decreases from 2022/2023 to 2023/2024)
- Yukon (-17%, from 237 days to 197 days)
- Nunavut (-11%, from 176 days to 157 days)
- Alberta (-14%, from 212 days to 183 days)
- Manitoba (-10%, from 259 days to 233 days)
- PEI (-9%, from 78 days to 71 days)
- Ontario (-8%, from 250 days to 229 days)
- Saskatchewan (-8%, from 176 days to 162 days)
- Nova Scotia (-1% from 317 days to 315 days)
The longest median case times in 2023/2024 were in Nova Scotia (315 days or 10.4 months), Newfoundland and Labrador (310 days or 10.2 months), New Brunswick (248 days or 8.2 months) and Manitoba (233 days or 7.7 months). Conversely, Saskatchewan (162 days or 5.3 months), Nunavut (157 days or 5.2 months) and Prince Edward Island (71 days or 2.3 months) had the shortest median case times.
Homicide, sexual assault, other sexual offences, attempted murder and other drug offences recorded the longest median case times in 2023/2024
From 2016/2017 to 2023/2024, increases in median case time were observed for almost allFootnote 13 offence types, notably sexual assault cases (+38%, from 328 days to 453 days), weapon offences cases (+37%, from 190 days to 261 days), other Criminal Code traffic offence cases (+35%, from 206 days to 279 days), and other sexual offence casesFootnote 14 (+33%, from 338 days to 448 days).
In 2023/2024, the longest median case times were observed in homicide cases (516 days or 17 months), sexual assault cases (453 days or 14.9 months), other sexual offence cases (448 days or 14.7 months), attempted murder cases (390 days or 12.8 months) and other drug offence casesFootnote 15 (342 days or 11.2 months). In comparison, theft cases (152 days or 5 months), disturbance of peace cases (144 days or 4.7 months), breach of probation cases (133 days or 4.4 months), Youth Criminal Justice Act cases (120 days or 3.9 months)Footnote 16 and cases where the accused was unlawfully at large (90 days or 3 months) were among those with the lowest median case times. Similar results were observed leading up to the Jordan decision in 2015/2016.Footnote 17Footnote 18
Percentage of total cases potentially at risk of exceeding the timelines established in R. v. Jordan
The percentage of cases that were potentially at risk of exceeding the Jordan timelines increased 3 percentage-points from 6% in 2016/2017 to 9% in 2023/2024
The percentage of adult criminal court cases in Canada that were potentially at risk of exceeding the Jordan timelines increased 3 percentage-points,Footnote 19 from 6% (20,619 cases) in 2016/2017 when the timelines came into effect to 9% (21,218 cases) in 2023/2024. From 2016/2017 to 2019/2020, there was a progressive decline in the percentage of adult cases potentially at risk of exceeding these timelines. In 2020/2021, however, the percentage of total adult cases potentially at risk of exceeding the timelines increased 3 percentage-points, going from 4% (11,966 cases) the prior year to 7% (16,642 cases). This figure increased to 10% (22,808 cases) in 2021/2022, then to 11% (23,819 cases) in 2022/2023, before decreasing to 9% (21,218 cases) in 2023/2024.Footnote 20
Newfoundland and Labrador, Nova Scotia, Ontario and Manitoba recorded the highest proportions of cases potentially at risk of exceeding the Jordan timelines in 2023/2024
From 2010/2011 to 2015/2016, Nova Scotia (+2 percentage points), Newfoundland and Labrador (+1 percentage point), the Northwest Territories (+1 percentage point) and New Brunswick (+1 percentage point) experienced minor increases in the percentage of cases potentially at risk of exceeding the timelines set out by R. v. Jordan. These increases continued in the years following the enactment of the Jordan timelines (2016/2017 to 2023/2024).
In 2023/2024, the proportions of cases potentially at risk of exceeding the Jordan timelines varied by jurisdictions, ranging from less than 1% to 18%. Newfoundland and Labrador (18%; 652 cases), Nova Scotia (16%; 1,353 cases), Ontario (12%; 13,216 cases) and Manitoba (11%; 1,655 cases) reported the highest proportions of cases potentially at risk of exceeding the timelines. From 2016/2017 to 2023/2024, the proportion of cases potentially at risk of exceeding the timelines increased by 10 percentage points in Newfoundland and Labrador, 9 percentage points in Nova Scotia, 8 percentage points in Ontario, and 6 percentage points in Manitoba.
Sexual assault, other sexual offences and offences related to sexual services recorded the highest percentage of cases potentially at risk of exceeding the Jordan timelines in 2023/2024
From 2016/2017 to 2023/2024, increases in the percentage of adult criminal court cases potentially at risk of exceeding the Jordan timelines were observed for all case types except those where a residual federal statute offence (-5 percentage points, from 11% to 6%), a homicide (-3 percentage points, from 13% to 10%), or an attempted murder (-1 percentage point, from 7% to 6%) was the most serious offence. During this time period, the case types that recorded the highest increases were sexual assault (+15 percentage points, from 15% to 30%), sexual service cases (+14 percentage points, from 1% to 15%) and other sexual offence cases (+13 percentage points, from 15% to 28%).
In 2023/2024, a few types of cases recorded notably higher percentages of cases potentially at risk of exceeding the Jordan timelines, such as sexual assault (30%), other sexual offence cases (28%) and cases related to sexual services (15%).
Percentage of cases potentially at risk of exceeding the Jordan timelines that were also stayed or withdrawnFootnote 21
The percentage of cases that were potentially at risk of exceeding the Jordan timelines that were also stayed or withdrawn increased 17 percentage points from 2016/2017 to 2023/2024
In 2023/2024, 45% (9,532 cases) of cases that were potentially at risk of exceeding the Jordan timelines were also stayed or withdrawn, an increase of 17 percentage points compared to 2016/2017 (28%; 5,724 cases). The most substantial increase occurred in 2020/2021 where it increased 12 percentage points from 32% (3,884 cases) the previous year (2019/2020) to 44% (7,324 cases). This percentage increased slightly to 47% in 2021/2022 (10,760 cases), where it remained in 2022/2023 (11,100 cases), to then decrease slightly to 45% (9,532 cases) in 2023/2024.Footnote 22
The Northwest Territories, Ontario and Alberta recorded the highest percentages of cases potentially at risk of exceeding the Jordan timelines that were also stayed or withdrawn in 2023/2024
After the Jordan timelines came into effect in 2016/2017, several provinces experienced significant increases in the percentage of cases potentially at risk of exceeding these timelines that were also stayed or withdrawn. From 2016/2017 to 2023/2024, the Northwest Territories (+36 percentage points)Footnote 23 and Ontario (+8 percentage points) saw the largest increases. By 2023/2024, the Northwest Territories (56%; 14 cases)Footnote 24, Ontario (48%; 6,402 cases), and Alberta (45%; 851 cases) had the highest percentages of cases that had been potentially at risk of exceeding the Jordan timelines when they were stayed or withdrawn.
Attempted murder recorded the highest percentage of cases potentially at risk of exceeding the Jordan timelines that were also stayed or withdrawn in 2023/2024
From 2016/2017 to 2023/2024, the percentage of adult criminal court cases potentially at risk of exceeding the Jordan timelines when the case resulted in a stay of proceedings or was withdrawn increased across all case types. During this time period, the types of cases that recorded the highest increases were Youth Criminal Justice Act cases (+82 percentage points, from 18% to 100%)Footnote 25, attempted murder cases (+45 percentage points, from 33% to 78%)Footnote 26 and criminal harassment cases (+26 percentage points, from 25% to 51%).
In 2023/2024, a few types of cases recorded notably high percentages of cases potentially at risk of exceeding the Jordan timelines that also received a decision of stayed or withdrawn, such as Youth Criminal Justice Act (100%; 8 cases), attempted murder (78%; 7 cases) and interestingly, the administration of justice offence of failure to appear (71%; 89 cases).Footnote 27 However, these data should be interpreted with caution due to the limited number of cases classified under these types of offences. The offence types that recorded a notably higher number of cases potentially at risk of exceeding the Jordan timelines that were also stayed or withdrawn include major assault cases (50%; 1,334 cases), common assault (46%; 1,024 cases), impaired driving offences (38%; 830 cases), sexual assault (43%; 526 cases) and the administration of justice offence of failure to comply with order (52%; 508 cases).
Conclusion
The Supreme Court of Canada’s R. v. Jordan (2016) decision set out time timelines for the completion of criminal court cases, which reinforced the importance of tracking and monitoring statistics related to court processing times. According to three key criminal court indicators that measure case processing times—referred to as “Jordan proxies” due to important limitationsFootnote 28—there have been increases in median case times and in the proportion of cases potentially at risk of exceeding the Jordan timelines with a stay of proceedings or withdrawn decision since 2016.
While all three Jordan proxies show increases in the years following the timelines coming into effect (2016/2017 to 2023/2024), the latest available year of data recorded a decrease from the previous year (2022/2023). For example, despite the overall increase (+28%) of median case time to process adult criminal court cases in the post-Jordan years, it decreased slightly (-7%) from 2022/2023 to 2023/2024. Similarly, despite the overall increase in the post-Jordan years (+3 percentage-points and +17 percentage-points from 2016/2017 to 2023/2024, respectively), the percentage of cases that were potentially at risk of exceeding the Jordan timelines and the percentage of cases that exceeded the Jordan timelines that were also stayed or withdrawn also decreased in the last year of available data (from 11% and 47% in 2022/2023 to 9% and 45% in 2023/2024, respectively).
Despite the decrease at the national level, Jordan proxy data suggest lengthier processing times may be of greater concern in the Atlantic region, specifically Newfoundland and Labrador, Nova Scotia, New Brunswick, and also in the Northwest Territories. However, Ontario and the West, specifically British Columbia, Alberta, and Manitoba, are also on an increasing trend for certain proxy indicators. Select violent offences such as homicide, attempted murder, sexual assault and other sexual offences continue to record negative Jordan proxy results.Footnote 29 Lastly, it is important to note that year-over-year trend analysis showed increases in case times can be partially attributed to the delays caused by the COVID-19 pandemic. Ongoing monitoring of trends is critical to ensuring timely processing of cases as a key indicator of the operation of the criminal justice system.
For more information, please contact:
Rsd-drs@justice.gc.ca
Criminal Court Case Indicators Related to the Jordan timelines, 2016/2017 to 2023/2024
J4-200/2026E-PDF
ISBN 978-0-662-32545-1
Annex I. Adult criminal court case indicators related to the Jordan limits, Canada, 2016/2017 to 2023/2024
The following table presents data pertaining to the three case processing time indicators related to the timelines established in R. v. Jordan (i.e., Jordan proxies) from 2016/2017 to 2023/2024 at the national level, namely 1) median number of days to complete adult criminal cases requiring more than seven days to resolve, 2) the percentage of total cases potentially at risk of exceeding the Jordan timelines, and 3) the percentage of cases potentially at risk of exceeding the Jordan timelines that were also stayed or withdrawn.Footnote 30 The table also presents the total number of completed adult criminal court cases to contextualize the data. The last two columns are included to highlight the changes over the last 8 years since the timelines set out by R. v. Jordan came into effect, as well as the changes over the last year of available data (i.e., from 2022/2023 to 2023/2024).
| Indicator | 2016/17 | 2017/18 | 2018/19 | 2019/20 | 2020/21 | 2021/22 | 2022/23 | 2023/24 | change from 2016/17 to 2023/24 (Post-Jordan years) |
change from 2022/23 to 2023/24 (Last year of available data) |
|---|---|---|---|---|---|---|---|---|---|---|
| Total completed adult criminal court casesFootnote 31 (N) |
355,951 | 349,275 | 315,203 | 317,367 | 237,364 | 221,317 | 219,154 | 228,425 | -35.8% | +4.2% |
| Median case time (days) |
169 | 169 | 169 | 177 | 234 | 234 | 233 | 217 | +48 days | -16 days |
| Cases potentially at risk of exceeding the Jordan timelines % (n) |
5.8 (20,619) |
5.4 (18,995) |
4.1 (12,963) |
3.8 (11,966) |
7.0 (16,642) |
10.3 (22,808) |
10.9 (23,819) |
9.3 (21,218) |
+3.5 percentage points | -1.6 percentage points |
| Cases potentially at risk of exceeding the Jordan timelines that were also stayed or withdrawn % (n) |
27.8 (5,724) |
31.5 (5,987) |
30.9 (4,009) |
32.5 (3,884) |
44.0 (7,324) |
47.2 (10,760) |
46.6 (11,100) |
44.9 (9,532) |
+17.1 percentage points | -1.6 percentage points |
Annex II. Adult criminal court case indicators related to the Jordan limits, changes pre- and post-COVID-19, 2016/2017 to 2023/2024
The following table presents changes over time pertaining to the three case processing time indicators related to the timelines established in R. v. Jordan (i.e., Jordan proxies) from 2016/2017 to 2023/2024 at the national level, according to three different time periods, all in the post-Jordan years currently available (2016/2017 to 2023/2024):
- Pre-COVID-19 period, which examines changes in the three Jordan proxies from 2016/2017—the year the Jordan timelines came into force—to 2018/2019—the year prior to the COVID-19 pandemic being declared—representing three years of Integrated Criminal Courts Survey (ICCS) data.
- COVID-19 period, which examines changes in the three Jordan proxies from 2019/2020—the year the COVID-19 was declared—to 2020/2021—the following year, which was the peak of COVID-19—representing an unprecedented two-year “COVID-19” period.
- Post-COVID-19 period, which examines changes in the three Jordan proxies from 2021/2022—the year following the peak COVID-19 year, although some of its impacts were still being experienced—to 2023/2024—the last year of available data—representing three years of ICCS data, matching a three-year pre-COVID-19 time period.
| Indicator | Change from 2016/17 to 2018/19 (Pre-COVID-19 period) |
Change from 2019/20 to 2020/21 (COVID-19 period) |
Change from 2021/22 to 2023/24 (Post-COVID-19 period) |
|---|---|---|---|
| Total completed adult criminal court casesFootnote 32 | -11% | -25% | +3% |
| Median case time | - | +57 days | -17 days |
| Percentage of cases potentially at risk of exceeding the Jordan timelines | -1.7 percentage-points | +3.2 percentage-points | -1.0 percentage-point |
| Percentage of cases potentially at risk of exceeding the Jordan timelines that were also stayed or withdrawn | +3.2 percentage points | +11.6 percentage-points | -2.3 percentage-points |
Annex III. Infosheet: Adult criminal court case indicators related to the Jordan timelines, 2016–2017 to 2023–2024
Adult Criminal court case indicators related to the Jordan timelines, 2016/2017 to 2023/2024 – Page 1
Text version
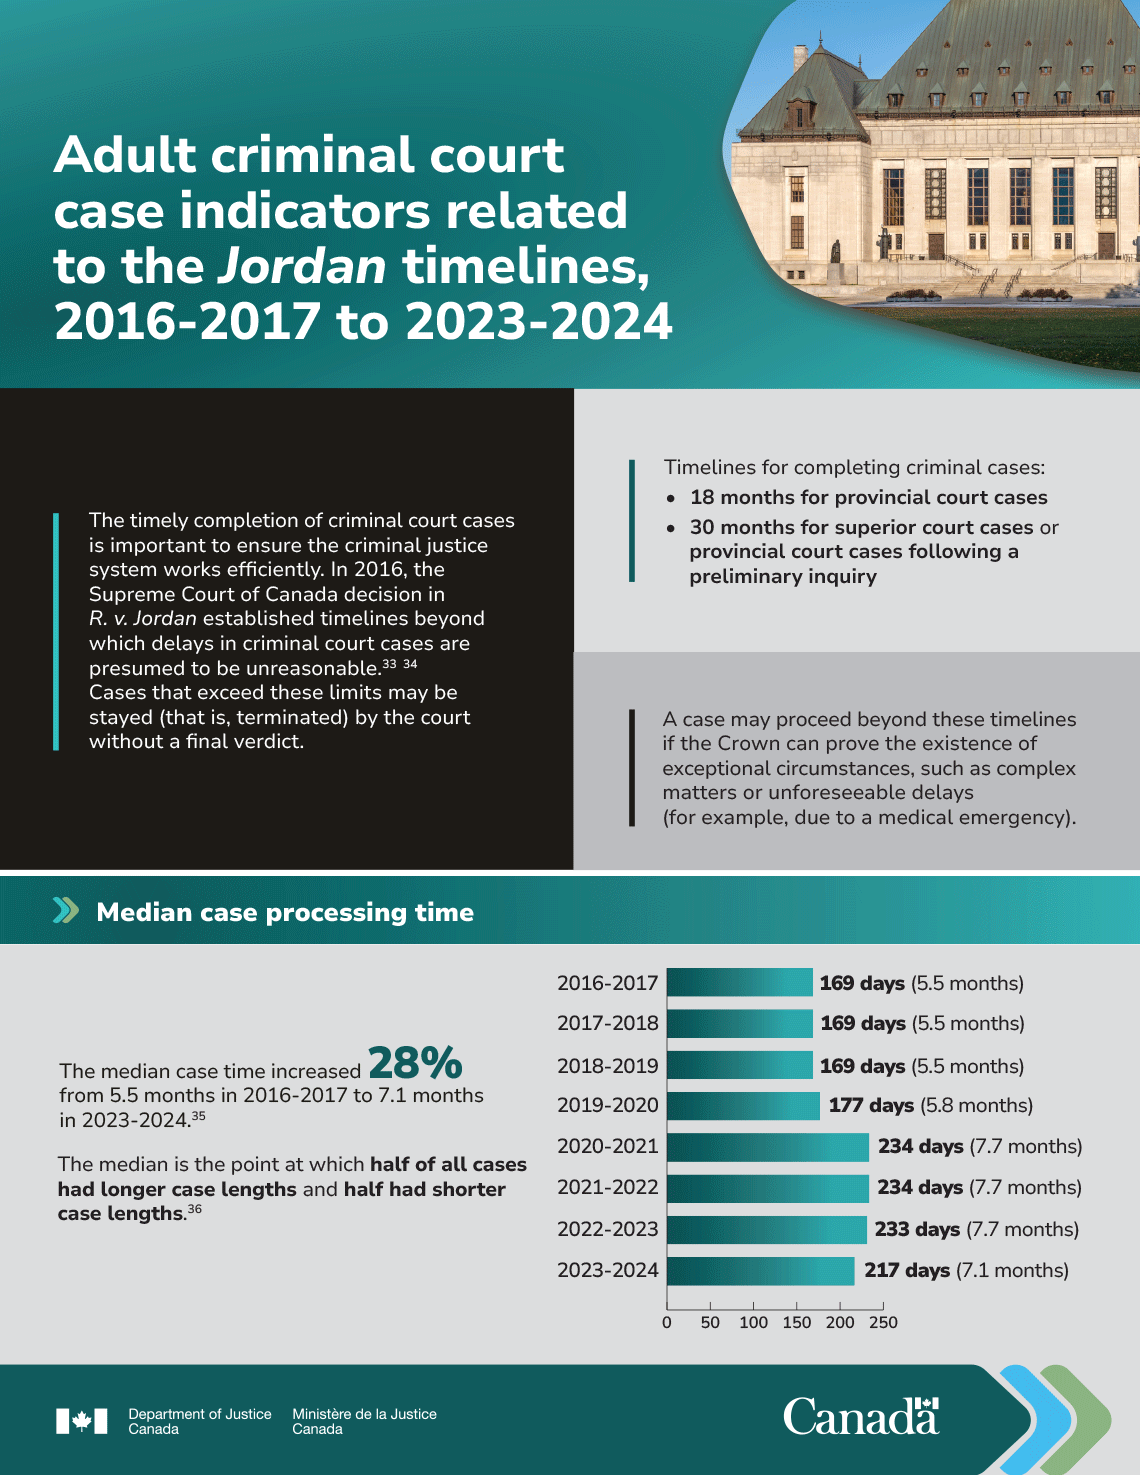
The timely completion of criminal court cases is important to ensure the criminal justice system works efficiently. In 2016, the Supreme Court of Canada decision in R. v. Jordan established timelines beyond which delays in criminal court cases are presumed to be unreasonable.Footnote 33Footnote 34 Cases that exceed these limits may be stayed (that is, terminated) by the court without a final verdict.
Timelines for completing criminal cases:
- 18 months for provincial court cases
- 30 months for superior court cases or provincial court cases following a preliminary inquiry
A case may proceed beyond these timelines if the Crown can prove the existence of exceptional circumstances, such as complex matters or unforeseeable delays (for example, due to a medical emergency).
Median case processing time
The median case time increased 28% from 5.5 months in 2016–2017 to 7.1 months in 2023-2024.Footnote 35
The median is the point at which half of all cases had longer case lengths and half had shorter case lengths.Footnote 36
| Year | Median case time in days (the equivalent in months) |
|---|---|
| 2016–2017 | 169 days (5.5 months) |
| 2017–2018 | 169 days (5.5 months) |
| 2018–2019 | 169 days (5.5 months) |
| 2019–2020 | 177 days (5.8 months) |
| 2020–2021 | 234 days (7.7 months) |
| 2021–2022 | 234 days (7.7 months) |
| 2022–2023 | 233 days (7.7 months) |
| 2023–2024 | 217 days (7.1 months) |
Adult Criminal court case indicators related to the Jordan timelines, 2016/2017 to 2023/2024 – Page 2
Text version
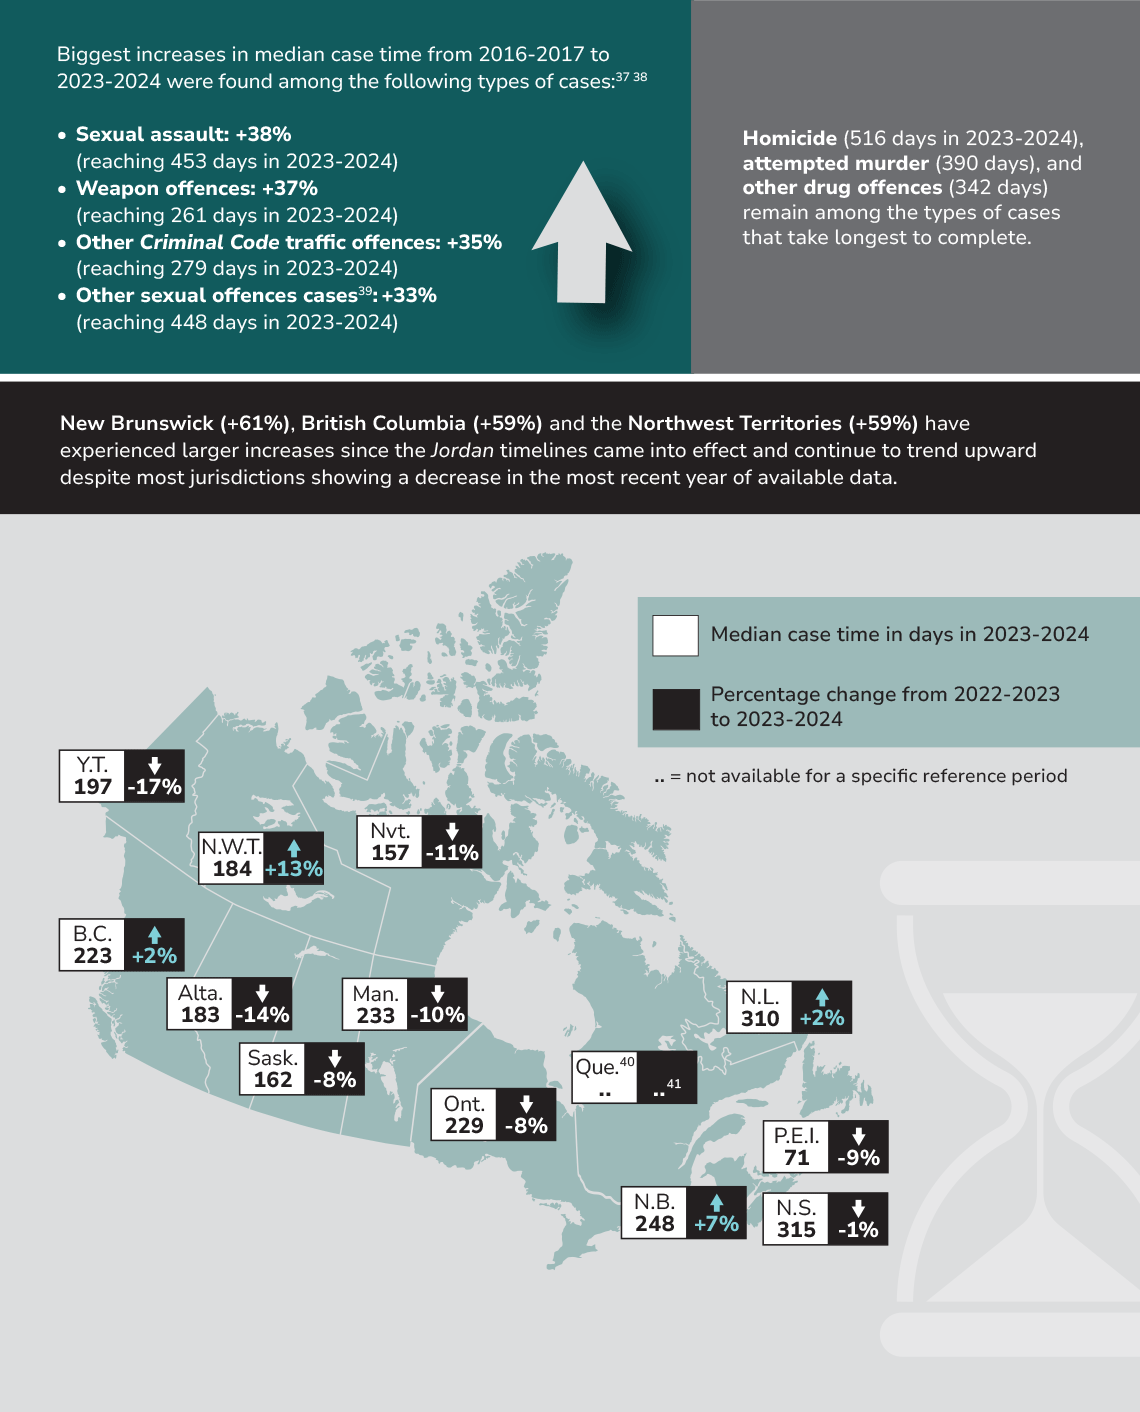
Biggest increases in median case time from 2016–2017 to 2023–2024 were found among the following types of cases:Footnote 37Footnote 38
- Sexual assault: +38% (reaching 453 days in 2023–2024)
- Weapon offences: +37% (reaching 261 days in 2023–2024)
- Other Criminal Code traffic offences: +35% (reaching 279 days in 2023–2024)
- Other sexual offences:Footnote 39 +33% (reaching 448 days in 2023–2024)
Homicide (516 days in 2023–2024), attempted murder (390 days), and other drug offences (342 days) remain among the types of cases that take longest to complete.
New Brunswick (+61%), British Columbia (+59%) and the Northwest Territories (+59%) have experienced larger increases since the Jordan timelines came into effect and continue to trend upward despite most jurisdictions showing a decrease in the most recent year of available data.
| Province/Territory | Percentage change from 2022–2023 to 2023–2024 |
|---|---|
| Newfoundland and Labrador | +2% |
| Prince Edward Island | -9% |
| Nova Scotia | -1% |
| New Brunswick | +7% |
| QuebecFootnote 40 | .. |
| Ontario | -8% |
| Manitoba | -10% |
| Saskatchewan | -8% |
| Alberta | -14% |
| British Columbia | +2% |
| Yukon | -17% |
| Northwest Territories | +13% |
| Nunavut | -11% |
| Province/Territory | Median case time in days in 2023–2024 |
|---|---|
| Newfoundland and Labrador | 310 days |
| Prince Edward Island | 71 days |
| Nova Scotia | 315 days |
| New Brunswick | 248 days |
| QuebecFootnote 41 | .. |
| Ontario | 229 days |
| Manitoba | 233 days |
| Saskatchewan | 162 days |
| Alberta | 183 days |
| British Columbia | 223 days |
| Yukon | 197 days |
| Northwest Territories | 184 days |
| Nunavut | 157 days |
Adult Criminal court case indicators related to the Jordan timelines, 2016/2017 to 2023/2024 – Page 3
Text version
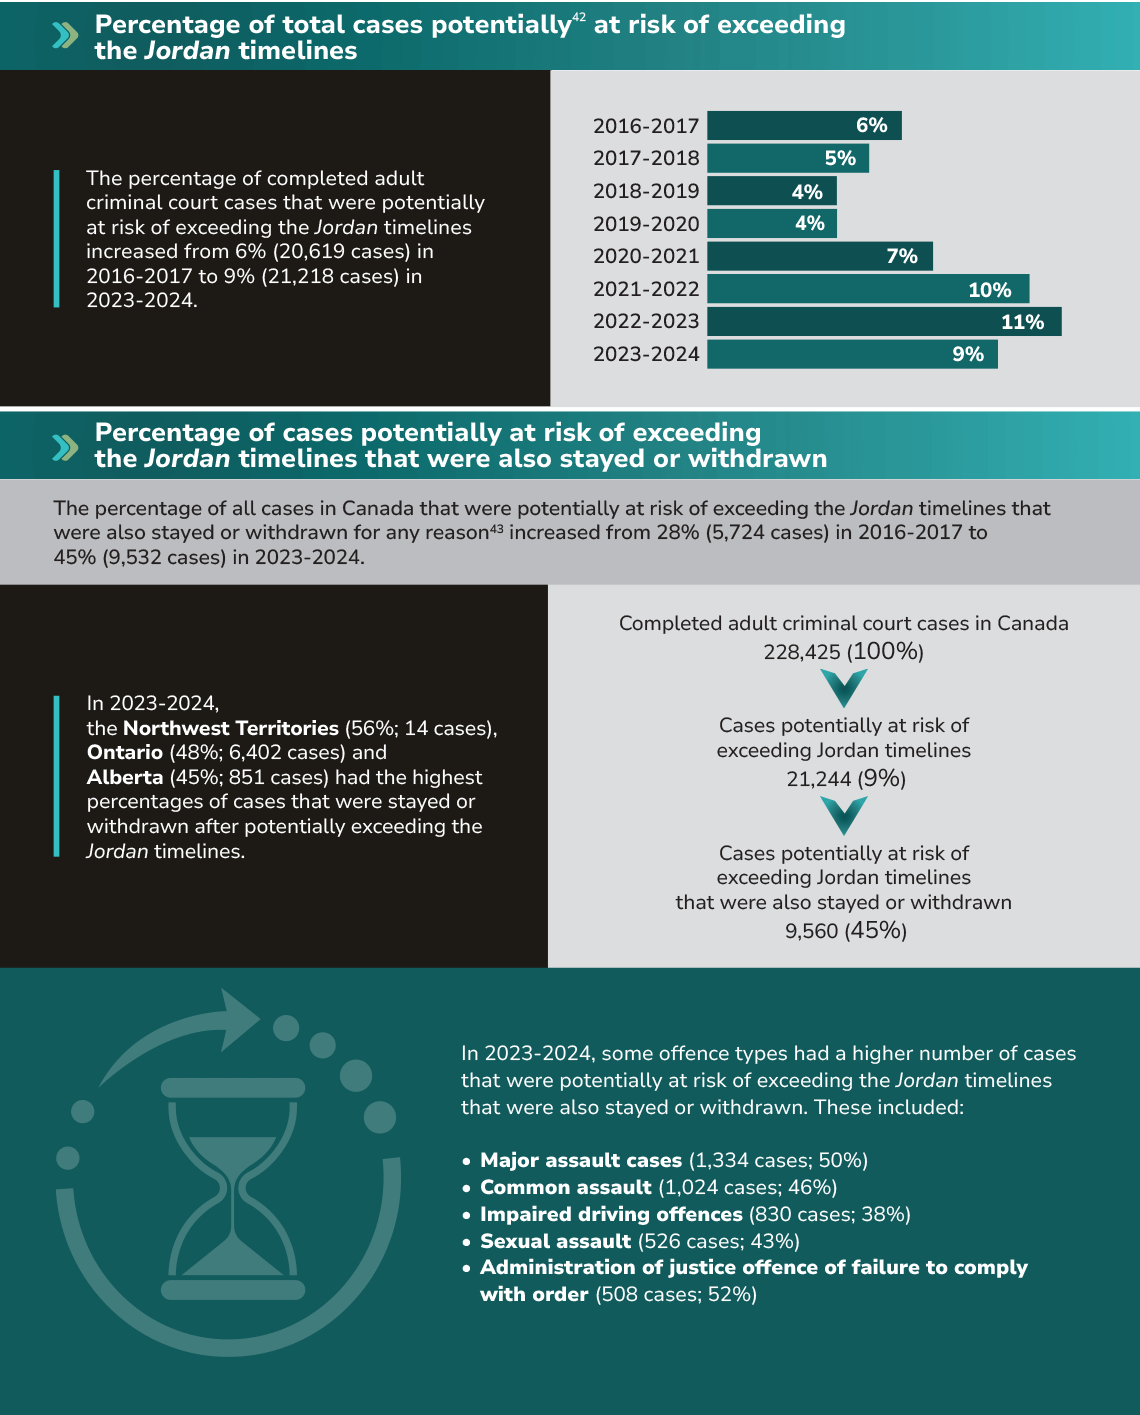
Percentage of total cases potentiallyFootnote 42 at risk of exceeding the Jordan timelines
The percentage of completed adult criminal court cases that were potentially at risk of exceeding the Jordan timelines increased from 6% (20,619 cases) in 2016–2017 to 9% (21,218 cases) in 2023–2024.
| Year | Percentage of cases potentially at risk of exceeding the Jordan timelines |
|---|---|
| 2016–2017 | 6% |
| 2017–2018 | 5% |
| 2018–2019 | 4% |
| 2019–2020 | 4% |
| 2020–2021 | 7% |
| 2021–2022 | 10% |
| 2022–2023 | 11% |
| 2023–2024 | 9% |
Percentage of cases potentially at risk of exceeding the Jordan timelines that were also stayed or withdrawn
The percentage of all cases in Canada that were potentially at risk of exceeding the Jordan timelines that were also stayed or withdrawn for any reasonFootnote 43 increased from 28% (5,724 cases) in 2016–2017 to 45% (9,532 cases) in 2023–2024.
In 2023–2024, the Northwest Territories (56%; 14 cases), Ontario (48%; 6,402 cases) and Alberta (45%; 851 cases) had the highest percentages of cases that were stayed or withdrawn after potentially exceeding the Jordan timelines.
- Completed adult criminal court cases in Canada = 228,425 (100%)
- Cases potentially at risk of exceeding Jordan timelines = 21,244 (9%)
- Cases potentially at risk of exceeding Jordan timelines that were also stayed and withdrawn = 9,560 (45%)
In 2023–2024, some offence types had a higher number of cases that were potentially at risk of exceeding the Jordan timelines that were also stayed or withdrawn. These included:
- Major assault (1,334 cases; 50%)
- Common assault (1,024 cases; 46%)
- Impaired driving offences (830 cases; 38%)
- Sexual assault (526 cases; 43%)
- Administration of justice offence of failure to comply with order (508 cases; 52%)
- Date modified: