
Profile and Projection of Drug Offences
In the Atlantic provinces (including Newfoundland, Prince Edward Island, Nova Scotia and New Brunswick)
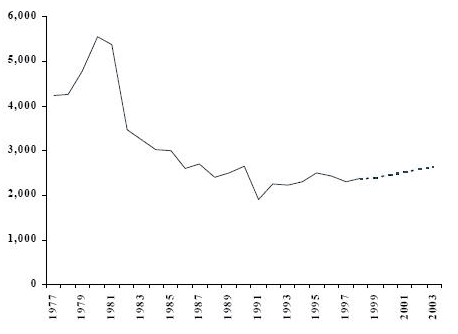
Figure 3. Number of adults charged with drug offecnes, Atlantic provinces, Actual (1977-1998) and Projected (1999-2003)
Source : Uniform Crime Reporting Survey (UCR), Canadian Centre for Justice Statistics
Description
This figure is a broken-line graph showing the actual (1977-1998) and projected (1999-2003) number of adults charged with drug offences in the Atlantic provinces (Newfoundland, Prince Edward Island, Nova Scotia, New Brunswick). From 1977 to 1980, the number of adults charged increases rapidly, going from 4,248 cases in 1977 to 5,550 in 1980, the highest during the period studied. This number decreases significantly in the 1980s and despite some fluctuations, finally reaches the lowest level for the period studied in 1991, with 1,913 cases. It then increases slowly, but remains below 3,000. The projection shows a similar trend, namely a slight increase from one year to the next, such that in 2003, the number of individuals charged should reach 2,652.
- Date modified: