
Exploring the Link between Crime and Socio-Economic Status in Ottawa and Saskatoon: A Small-Area Geographical Analysis
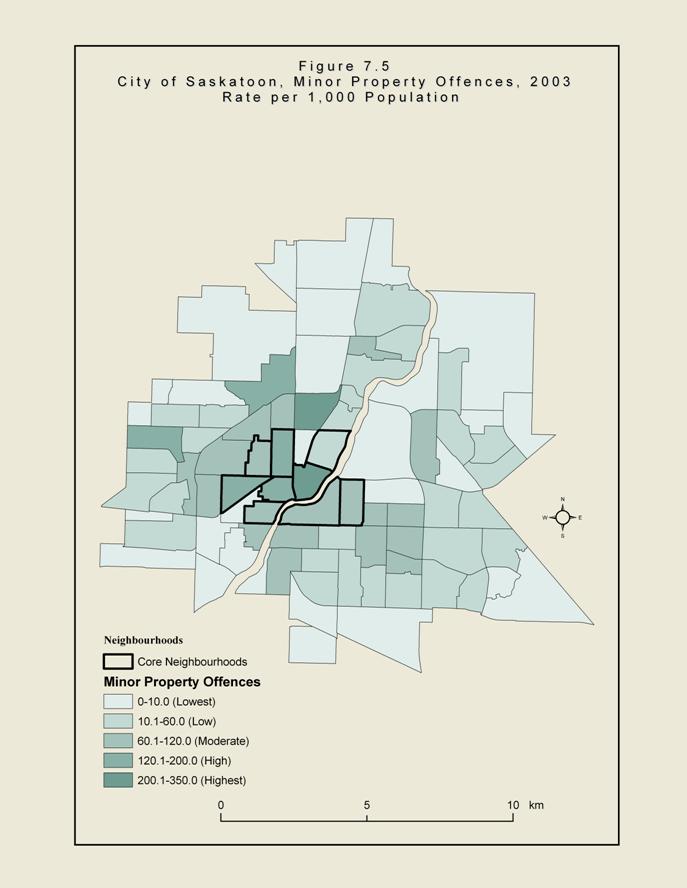
Figure 7.5 - City of Saskatoon, Minor Property Offences, 2003, Rate per 1,000 Population
Text Version
The map shows the rate of major property offences in Saskatoon neighbourhoods in 2003. Neighbourhoods with the lowest rate of minor property offences (0 to 10.0) are represented by a light green, those with low rates of minor property offences (10.1 to 60.0) are represented by a slightly darker green, neighbourhoods with moderate rates of minor property offences (60.1 to 120.0) are represented by a darker green, neighbourhoods with high rates of minor property offences (120.1 to 200.0) are represented by a dark green and neighbourhoods with the highest rates of minor property offences (200.1 to 350.0) are represented by a darker green.
The map demonstrates that the areas with high and the highest rates of minor property offences are dispersed around the city and many are seen in neighbourhoods in the Western part of the city, with many clustered in and around Saskatoon’s inner city.
- Date modified: