
Revenues and expenditures
Revenues are all monies received by the legal aid plan for the provision of legal aid services; revenues come from three main sources: government contribution funding, client contributions and cost recoveries, and contributions from the legal profession. Federal government contributions are the federal funding amounts for criminal, and where applicable, I&R legal aid. Federal funding for criminal legal aid flows to the consolidated revenue fund of each province or territory and is subsequently allocated by the provinces or territories to their respective legal aid plans. In 2023-24, five of the eight agreements for I&R legal aid were with service providers (in British Columbia, Manitoba, Ontario, Nova Scotia, and New Brunswick), meaning funding was allocated directly to these organizations. Provincial/territorial contributions are the funding amounts received for legal aid services from the legal aid plan of the respective government. Client contributions are all monies received from the client for legal assistance. Cost recoveries refer to the party costs ordered or agreed to be recovered in the case (this includes monies recovered from a judgement, award or settlement). Contributions of the legal profession and interest earned from lawyers’ trust accounts are all monies received from the law profession (e.g., provincial/territorial law foundation funding, levies, etc.), as well as other revenues that have not already been accounted for in the other categories.
Expenditures are payments made by legal aid plans to private law firms for the delivery of legal services, and the costs of legal services delivered by legal aid plan staff. These expenditures include monies spent on the provision of legal advice and representation to clients. All legal aid office and contracted community clinic expenditures are a combination of direct and indirect service delivery costs. Direct service delivery costs are expenses related to providing services directly to clients, while indirect service delivery costs are expenses not directly related to providing legal aid services to clients but are reasonably attributable to the delivery of legal aid.
Provinces and territories contributed half of legal aid revenues in 2023-24
Legal aid plan revenues totaled over $1.43 billion in 2023-24. Federal and provincial/territorial (P/T) government sources contributed seventy percent (70%) of the total, continuing a decreasing trend from previous years. This decrease is largely attributed to an almost seven-fold increase in contributions from the legal profession in Ontario, which increased from $45 million in 2021-22Footnote 9 to over $330 million in 2023-24 (Table 1).
In 2023-24, direct funding from P/T governments contributed more than $719 million to legal aid plans across Canada, which amounted to 50% of total legal aid revenues. Using a constant 2024-dollar comparison, this was an 8% decrease from the previous year.
In 2023-24, Justice Canada contributed over $287 million to the provinces and territories for the delivery of criminal legal aid across Canada, civil legal aid in the territories, and I&R legal aid where applicable. This amounts to 20% of total legal aid revenues, however this is an underestimate of federal contributions to legal aid because federal contributions to civil legal aid in the provinces is not counted (Table 1). Using constant 2024 dollars, this represents a 10% increase from the previous year. Ontario is the largest legal aid plan in the country comprising 53% of all legal aid plan revenues. Quebec, Alberta, and British Columbia are the next largest legal aid plans, all similar sizes, comprising 13%, 12%, 10% of all legal aid plan revenues respectively (Table 1).
In 2023-24 Justice Canada allocated funding to cover 100% of the forecasted I&R legal aid expenditures of more than $88 million (Table 1). However, the actual expenditure of $99 million (Table 2a) exceeded the total forecasted. As a result, the federal contribution covered 89% of 2023-24 I&R legal aid expenditures.
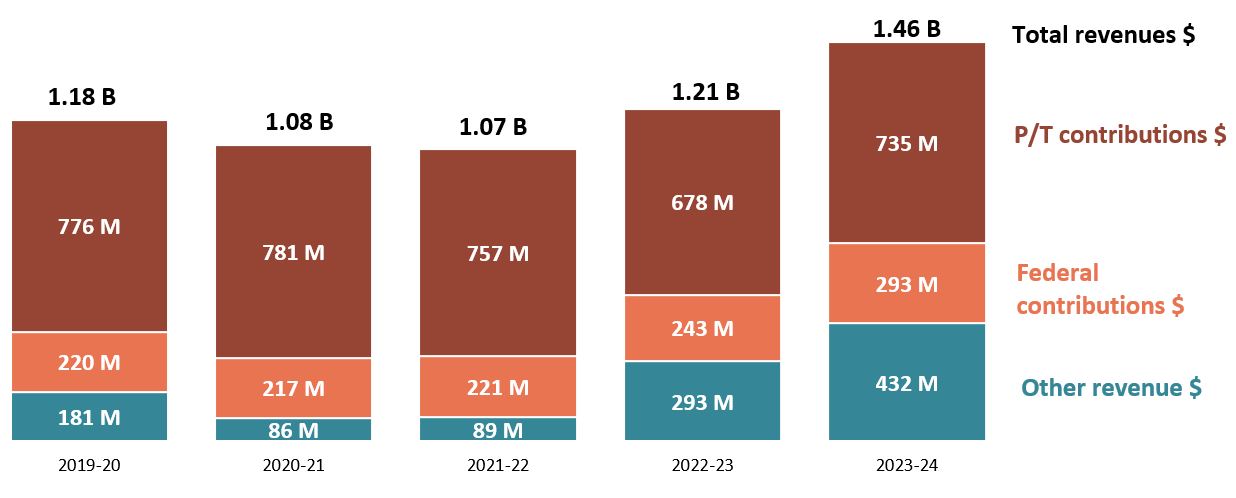
Figure 1 shows the breakdown between legal aid revenue sources over the past five years, using constant 2024 dollars, which are used to account for the impact of inflation over time. There was a gradual increase in federal contributions to legal aid revenues over time, in parallel to a reduction in P/T contributions. However, this trend levelled off in 2020-21 and the proportion of federal contributions has been consistent at about 20% of all revenues over the past five years. In 2022-23, a new trend emerged where the proportion of P/T contributions decreased concurrent with an increase in the proportion of other revenues from Ontario (specifically contributions of the legal profession and interest earned from lawyers' trust accounts), which increased substantially. Total revenues surpassed pre-pandemic amounts in 2023-24 up 24% from five years ago, and 20% from 2022-23 (using a 2024 constant dollar comparison).
Figure 1
Legal aid plan revenues surpassed pre-pandemic levels in 2023-24 with total revenues up 24% compared to 2019-20.
Text version
There is a vertical graph with five different categories representing federal contributions to legal aid revenue. There are five bars for each category showing contributions by year. Each bar is broken down into three color categories: dark orange at the top, medium orange in the middle and turquoise at the bottom of the bar. The dark orange section represents Provincial/Territorial (P/T) contributions, the medium orange section represents federal contributions, the turquoise section represents other revenue money.
The first bar shows financial contributions for 2019-2020. At the top of this bar is a number showing the total revenues of 1.18 billion dollars. The top section of this bar shows P/T contributions of 776 million dollars (dark orange), 220 million in federal contributions (medium orange) and 181 million in other revenue (turquoise).
The second bar shows financial contributions for 2020-2021. At the top of this bar is a number showing the total revenues of 1.08 billion dollars. The top section of this bar shows P/T contributions of 781 million (dark orange), 217 million in federal contributions (medium orange) and 86 million in other revenue (turquoise).
The third bar shows financial contributions for 2021-2022. At the top of this bar is a number showing the total revenues of 1.07 billion dollars. The top section of this bar shows P/T contributions of 757 million (dark orange), 221 million in federal contributions (medium orange) and 89 million in other revenue (turquoise).
The fourth bar shows financial contributions for 2022-2023. At the top of this bar is a number showing the total revenues of 1.21 billion dollars. The top section of this bar shows P/T contributions of 678 million (dark orange), 243 million in federal contributions (medium orange) and 293 million in other revenue (turquoise).
The fifth bar shows financial contributions for 2023-2024. At the top of this bar is a number showing the total revenues of 1.46 billion dollars. The top section of this bar shows PT contributions of 735 million (dark orange), 293 million in federal contributions (medium orange) and 432 million in other revenue (turquoise).
Source: Table 1 - Legal aid plan revenues, by source of revenue, 2019-20 to 2023-24 (Figure uses constant 2024 dollars as calculated March 19, 2025).
Legal aid plan expenditures returned to pre-pandemic levels in 2023-24
Using amounts unadjusted for inflation, in 2023-24 legal aid plan expenditures were over 1.15 billion dollars. Broken down by type of expenditure, 52% were related to criminal matters, 39% were related to all other civil matters, and 9% were related to I&R matters (Table 2a). While in most jurisdictions there is roughly an even split between expenditures on criminal and civil matters, a large proportion spend more on criminal matters. The jurisdictions with the highest proportion of total legal aid expenditures on criminal matters of all legal aid expenditures for that jurisdiction were, Manitoba (93%), Saskatchewan (80%), and Alberta (79%). Only three jurisdictions, Quebec (57%), Ontario (55%), and Prince Edward Island (51%) spent more on civil matters (including I&R in Quebec and Ontario only, not Prince Edward Island where I&R legal aid services are not available). At the national level, however, 52% of legal aid expenditures were related to criminal matters. This is because Quebec and Ontario spent more overall, thus contributing more to the average.
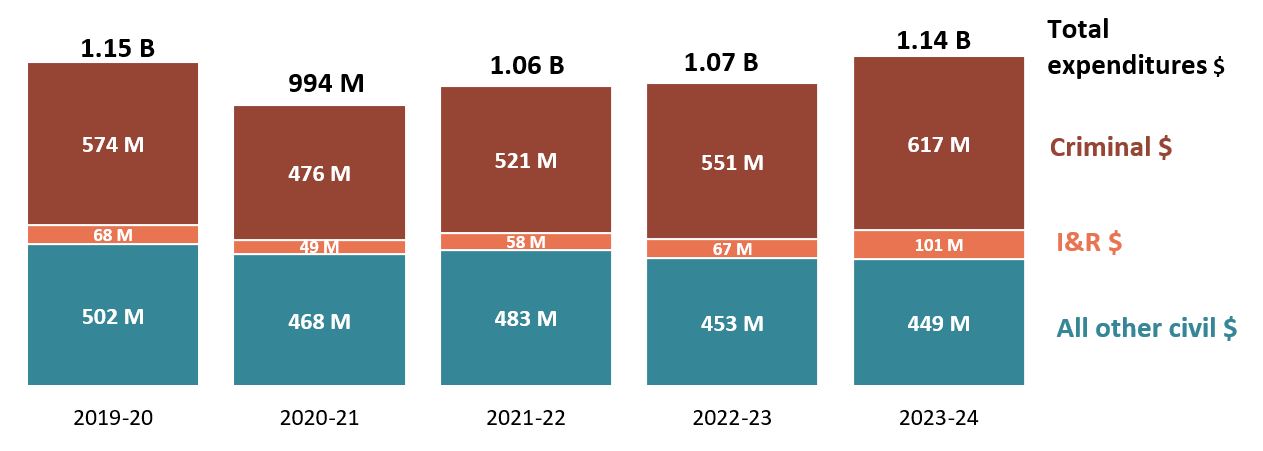
Figure 2 shows the breakdown of expenditures by type of matter over the past five years using constant 2024 dollars adjusted for inflation. Expenditures have gradually trended upwards since 2020-21, and in 2023-24 they were close to pre-pandemic expenditures, down just 1% from five years ago. In 2023-24, criminal expenditures were up 12% from 2022-23, I&R expenditures were up 52%, and civil expenditures were down 1%. The increase in I&R expenditures is due to significantly increased demand for services and additional funding provided in Budget 2023 to address pressures.
Figure 2
In 2023-24 legal aid plan expenditures were on par with pre-pandemic levels, down just 1% compared to 2019-20.
Text version
There is a vertical bar graph with five different categories representing legal aid plan expenditures, by type of expenditure. There are five bars for each category showing contributions by year. Each bar is broken down into three color categories: dark orange at the top, medium orange in the middle and turquoise at the bottom of the bar. The dark orange section represents criminal expenditures, the medium orange section represents immigration and refugee (I&R) expenditures, and the turquoise section represents other civil expenditures.
The first bar shows legal aid plan expenditures for 2019-2020. At the top of this bar is a number showing the total expenditures of 1.15 billion dollars. The top section of this bar is dark orange and shows criminal expenditures of 574 million dollars, the middle section is medium orange and shows 68 million in immigration and refugee (I&R) expenditures, and the third section is turquoise and shows 502 million in all other civil expenditures.
The second bar shows legal aid plan expenditures for 2020-2021. At the top of this bar is a number showing the total revenues of 994 million dollars. The top section of this bar is dark orange and shows criminal expenditures of 476 million dollars, the middle section is medium orange and shows 49 million in immigration and refugee (I&R) expenditures, and the third section is turquoise and shows 468 million in all other civil expenditures.
The third bar shows legal aid plan expenditures for 2021-2022. At the top of this bar is a number showing the total revenues of 1.06 billion dollars. The top section of this bar is dark orange and shows criminal expenditures of 521 million dollars, the middle section is medium orange and shows 58 million in immigration and refugee (I&R) expenditures, and the third section is turquoise and shows 483 million in all other civil expenditures.
The fourth bar shows legal aid plan expenditures for 2022-2023. At the top of this bar is a number showing the total revenues of 1.07 billion dollars. The top section of this bar is dark orange and shows criminal expenditures of 551 million dollars, the middle section is medium orange and shows 67 million in immigration and refugee (I&R) expenditures, and the third section is turquoise and shows 453 million in all other civil expenditures.
The fifth bar shows legal aid plan expenditures for 2023-2024. At the top of this bar is a number showing the total revenues of 1.14 million dollars. The top section of this bar is dark orange and shows criminal expenditures of 617 million dollars, the middle section is medium orange and shows 101 million in immigration and refugee (I&R) expenditures, and the third section is turquoise and shows 449 million in all other civil expenditures.
Source: Table 2a - Legal aid plan expenditures, by type of matter, 2019-20 to 2023-24 (Figure uses constant 2024 dollars as calculated March 19, 2025).
The two largest legal aid plans, Ontario and Quebec, had the highest legal aid expenditures in the country in 2023-24, with 46% of all expenditures as a proportion of the national total from Ontario and 20% from Quebec.
Table 2b breaks out the total administrative costs for legal aid plans in 2023-24. These expenses are also reflected under “Legal Services Expenditures” in Table 2a, and they amounted to over 129 million dollars, up 16% from the previous year.
- Date modified: