
Legal aid clients
Legal aid plans provide services to clients to help them with their legal problems in the areas of criminal, family, child protection, civil non-family (e.g., landlord and tenant disputes, poverty law), and immigration and refugee law. Data in this section show the gender and age of legal aid clients who received summary service and full legal representation in 2023-24 by type of matter. Data on immigration and refugee matters are excluded from this section because many legal aid plans only collect data for the principal claimant (i.e., head of family), so gender and age–based data may not reflect the actual number and profile of individuals receiving I&R services.
Most legal aid clients were male, and accessed criminal legal aid services
In 2023-24, of the 434,812 legal aid clients (excluding I&R), 59% percent were male, and 35% were female, with the remaining 5% falling under the category of “other” which represents gender diverse people, and unknown responses. The most common age category of legal aid clients was 18-34 (39%) (Table 12). These proportions have remained consistent over the past five years. Figure 14 shows the gender and age breakdown of legal aid clients for all types of matters combined (excluding I&R), with males aged 18-34 making up the highest proportion of clients (24%), followed by males aged 35-49 (21%) and females aged 18-34 (15%). Notably, while males made up a higher proportion of criminal legal aid clients, females made up a higher proportion of civil legal aid clients.
Figure 14
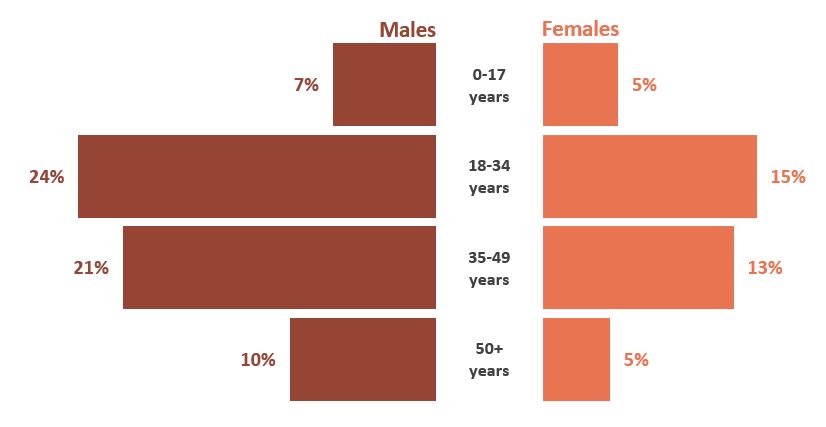
Males aged 18-34 years made up the highest proportion of legal aid clients overall.
Text version
There is a population pyramid bar chart that shows age and gender distribution of legal aid clients in Canada during 2023-2024. There are four different age categories with bars representing males and females seeking legal aid.
The first category is for people aged 0-17. The dark orange bar on the left-hand side (male) shows that 7% of males seeking legal aid were males aged 0-17. The medium orange bar on the right-hand side (female) shows that 5% of females seeking legal aid were females aged 0-17.
The second category is for people aged 18-34. The dark orange bar on the left-hand side (male) shows that 24% of males seeking legal aid were males aged 18-34 which is the highest proportion of legal aid clients for all types of matters. The medium orange bar on the right-hand side (female) shows that 15% of females seeking legal aid were in this age category.
The third category is for people aged 35-49. The dark orange bar on the left side (male) shows 21% of males seeking legal aid were males aged 35-49. The medium orange bar on the right shows 13% of females seeking legal aid were females aged 35-49
The fourth category is for people aged 50+. The dark orange bar on the left shows that 10% of males seeking legal aid were males aged 50+, and the medium orange bar on the right shows 5% of females seeking legal aid were in this age category.
Source: Table 12 - Legal aid clients, by age, gender, and type of matter, Canada, 2023-24 (excludes I&R and ‘other’ category – gender diverse people, and unknown responses. Other category represents less than 5% of all clients). Total number of clients = 412,618.
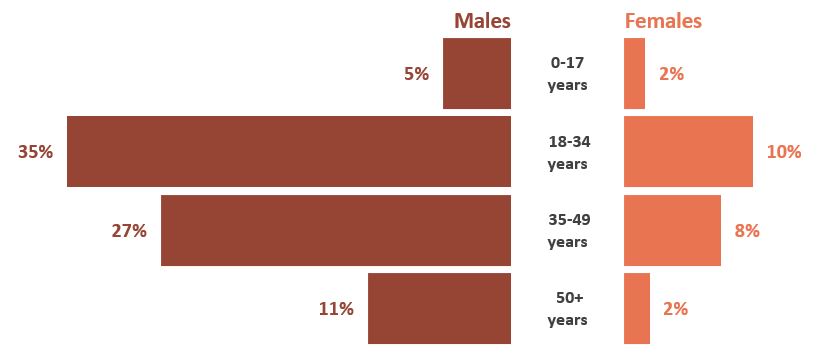
Figure 15 shows the age and gender breakdown of criminal legal aid clients. For criminal matters, young males made up a significant proportion, with males aged 18-34 (35%) representing the largest group followed by males 35-49 (27%).
Figure 15
Males aged 18-34 years made up the highest proportion of criminal legal aid clients.
Text version
There is a population pyramid bar chart that shows age and gender distribution of criminal legal aid clients in Canada during 2023-2024. There are four different age categories with bars representing male and females seeking legal aid.
The first category is for people aged 0-17. The dark orange bar on the left-hand side (male) shows that 5% of males seeking legal aid were males aged 0-17. The medium orange bar on the right-hand side (female) shows that 2% of females seeking legal aid were females aged 0-17.
The second category is for people aged 18-34. The dark orange bar on the left-hand side (male) shows that 35% of males seeking legal aid were males aged 18-34. The medium orange bar on the right-hand side (female) shows that 10% of females seeking legal aid were in this age category.
The third category is for people aged 35-49. The dark orange bar on the left side (male) shows 27% of males seeking legal aid were males aged 35-49. The medium orange bar on the right shows 8% of females seeking legal aid were females aged 35-49
The fourth category is for people aged 50+. The medium orange bar on the left shows that 11% of males seeking legal aid were males aged 50+, and the medium purple bar on the right shows 2% of females seeking legal aid were in this age category.
Source: Table 12 - Legal aid clients, by age, gender, and type of matter, Canada 2023-24 (excludes ‘other’ category – gender diverse people, and unknown responses, which represents less than 5% of all clients). Total number of clients = 228,489
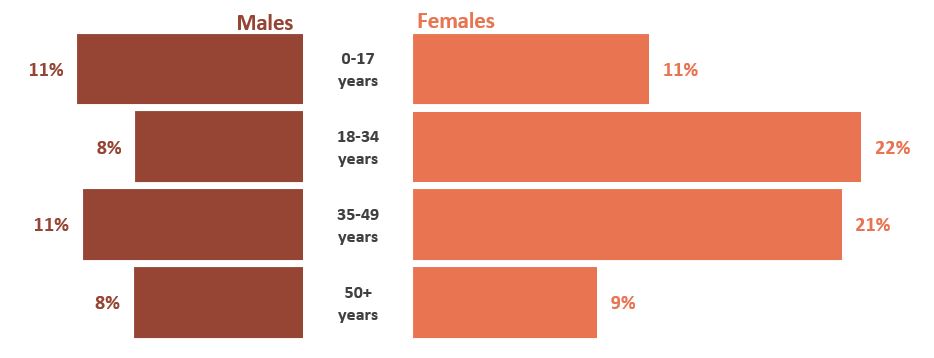
Figure 16 shows the gender and age breakdown of civil legal aid clients. For civil matters, females made up the highest proportion of clients, with those aged 18-34 (22%) and 35-49 (21%) making just under half of these clients.
Figure 16
Females aged 18-49 years made up just over two out of five civil legal aid clients.
Text version
There is a population pyramid bar chart that shows age and gender distribution of civil legal aid clients in Canada during 2023-2024. There are four different age categories with bars representing male and females seeking legal aid.
The first category is for people aged 0-17. The dark orange bar on the left-hand side (male) shows that 11% of males seeking legal aid were males aged 0-17. The medium orange bar on the right-hand side (female) shows that 11% of females seeking legal aid were females aged 0-17.
The second category is for people aged 18-34. The dark orange bar on the left-hand side (male) shows that 8% of males seeking legal aid were males aged 18-34. The medium orange bar on the right-hand side (female) shows that 22% of females seeking legal aid were in this age category.
The third category is for people aged 35-49. The dark orange bar on the left side (male) shows 11% of males seeking legal aid were males aged 35-49. The medium orange bar on the right shows 21% of females seeking legal aid were females aged 35-49.
The fourth category is for people aged 50+. The dark orange bar on the left shows that 8% of males seeking legal aid were males aged 50+, and the medium orange bar on the right shows 9% of females seeking legal aid were in this age category.
Source: Table 12 - Legal aid clients, by age, gender, and type of matter, Canada 2023-24 (excludes ‘other’ category – gender diverse people, and unknown responses, which represents less than 5% of all clients). Total number of clients = 150,571.
Indigenous clients
Just under 6 in 10 Indigenous legal aid clients were males accessing criminal legal aid services
Legal aid plans from Newfoundland and Labrador, Prince Edward Island, New Brunswick, Nova Scotia, Ontario, Manitoba, Saskatchewan, British Columbia, and Northwest Territories provided data on self-identified Indigenous legal aid clients. Out of the 50,865Footnote 21 Indigenous clients that self-identified in these jurisdictions in 2023-24, 80% accessed criminal legal aid (adult and youth), while 20% accessed civil legal aid (table 13). This is significantly higher than the proportion of all legal aid clients, where 56%Footnote 22 of clients accessed criminal legal aid.
Overall, two thirds (66%) of Indigenous legal aid clients were male, a proportion slightly higher than the general population of clients where 59% were male. Males represented 74% of Indigenous adult and youth criminal legal aid clients, but only 33% of Indigenous civil legal aid clients (Figure 17).
Figure 17
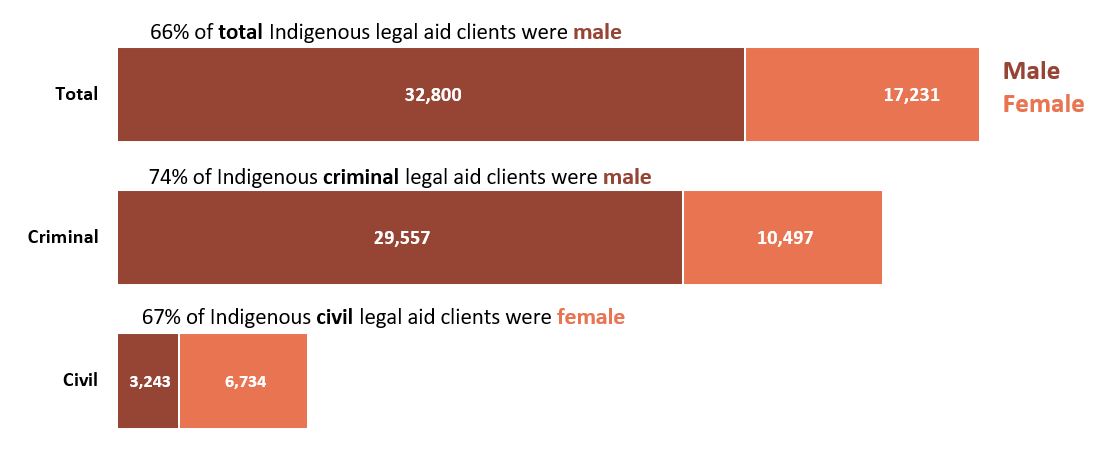
Indigenous males made up three quarters of Indigenous criminal legal aid clients, while Indigenous females made up more than two-thirds of Indigenous civil legal aid clients.
Text version
This graph displays a stacked bar chart with three horizontal bars. The legend says that data for men are shown in dark orange; data for women are in medium orange.
The top bar indicates that 66% of all indigenous legal aid clients were male. The left portion of the bar in dark orange indicates 32,800 males, and the right portion of the bar in medium orange indicates 17,231 females.
The second bar indicates 74% of indigenous criminal legal aid clients were male. The left portion of the bar in dark orange indicates 26,557 were male, and the right portion of the bar in medium orange indicates 10,497 were women.
The third and final bar states that 67% of indigenous civil legal aid clients were female. The left portion of the bar in dark orange indicates there are 3,243 males, and the right portion of the bar in medium orange indicates 6,734 females.
Source: Table 13 - Indigenous legal aid clients receiving full legal representation and summary services, by gender and type of matter, 2023-24 (excludes ‘other’ category which includes gender diverse people, and unknown responses).
- Date modified: