
Family structures in Canada, 1921 to 2024
June 2026
This fact sheet provides an overview of changes in Canadian family structures using publicly available data from Statistics Canada, including the Census of Population, the 2001, 2011 and 2017 General Social Survey on FamiliesFootnote 1 and the Canadian Vital Statistics: Birth Database. The data used in this fact sheet span different time periods, ranging from 1921 to 2024, based on the availability of data. The fact sheet analyzes trends in couple relationships, family composition, household living arrangements, and fertility in Canada.
While the number of census families increased between 2011 and 2021, the proportion of families with children remained stableFootnote 2
In 2021, there were 10.3 million census families,Footnote 3 of which 4.3 million (42%) did not include children and 6 million (58%) included children (see Table 1). While the number of census families with children increased by 6% between 2011 (from 5.6 million) and 2021, their proportion among all census families remained stable (60% in 2011 and 58% in 2021). Most census families with children were couple families with children, accounting for 72% of families with children (or 4.3 million) in 2021. There were also 1.7 million lone-parent families in 2021, representing the remaining 28% of census families with children. In 2011, the proportion of couple families with children (73%) and lone-parent families (27%) were comparable to the 2021 proportions, signaling little change in the census family structure over the course of the decade.
While there was a large increase in the number of common-law couples between 1981 and 2021, these relationships represented only one in four couples in Canada in 2021Footnote 4
Between 1981 and 2021, the number of couples living in common-law relationships in Canada increased by 447%, far exceeding the 26% increase in married couples over the same period. Despite this rapid growth in common-law unions, marriage remained the predominant type of union in Canada, accounting for more than three-quarters (77%) of unions in 2021 (see Figure 1).Footnote 5 While living in a common-law relationship was historically associated with young adults, older adults aged 55 to 69 are increasingly choosing common-law relationships, up from 13% in 2016 to 16% in 2021. In fact, Canada recorded the highest share of common-law couples among all G7 countries in 2021. This is largely due to the higher proportion of couples living in common-law in Quebec (43%) and Nunavut (52%) compared to the national average (23%) in 2021. In 2021, Nunavut became the first jurisdiction where most couples lived in common-law relationships.
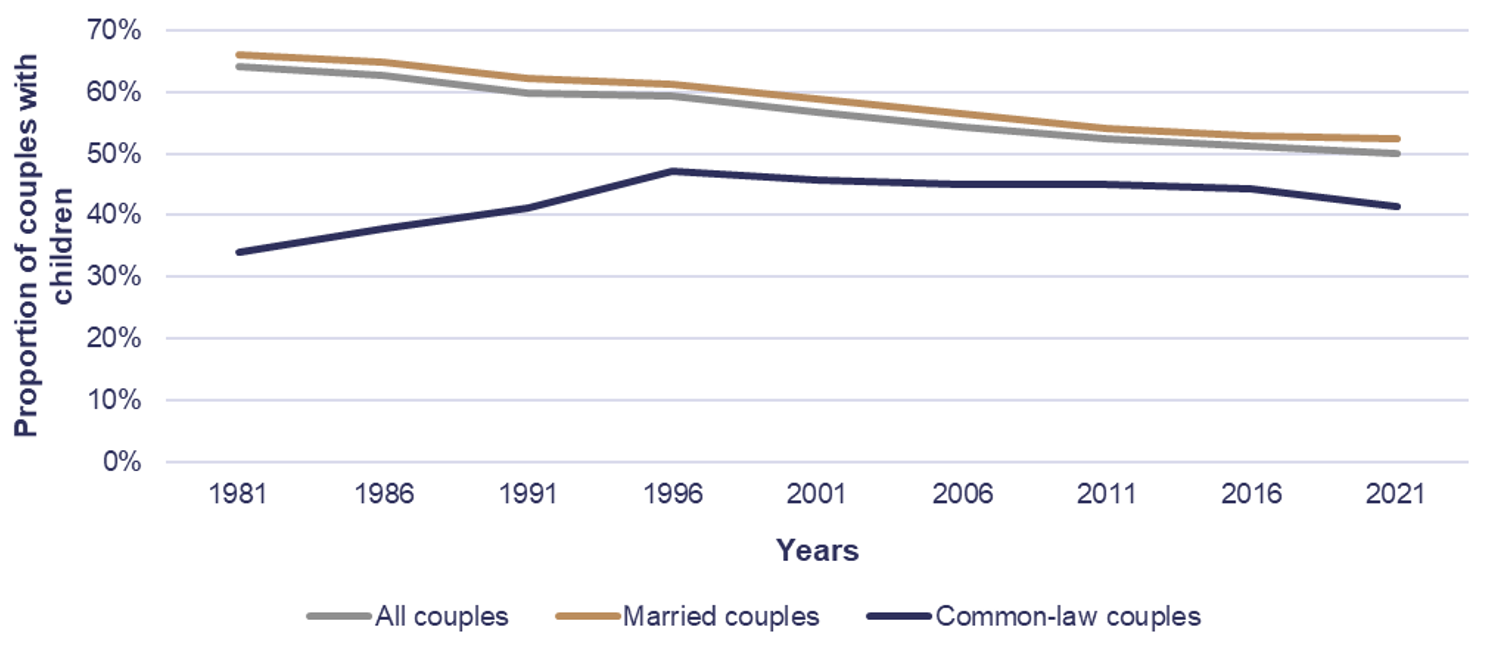
Figure 1. Proportion of couples with children in Canada, by married and common-law relationships, 1981 to 2021
Text version
This line chart titled “Proportion of couples with children in Canada, by married and common-law relationships, 1981 to 2021” shows how the percentage of couples with children changed over time for three groups: all couples, married couples, and common-law couples. The horizontal axis displays years from 1981 to 2021, and the vertical axis shows percentages from 0% to 70%.
Overall, the chart shows a steady decline in the proportion of couples with children among married couples and all couples, while common-law couples follow a different pattern with an increase followed by a decline.
- For all couples the proportion starts at 64% in 1981 and decreases steadily to 53% in 2021
- For married couples the propoertion starts slightly higher at 66% in 1981 and declines to 50% in 2021
- For common-law couples the proportion starts much lower at 38% in 1981 then increases steadily to a peak of 47% in 1996, following by a gradual decline to 42% by 2021
Source: Statistics Canada. 2022. State of the union: Canada leads the G7 with nearly one-quarter of couples living common law, driven by Quebec. The Daily.
The proportion of couples living apart from their partners remained stable between 2006 and 2017, ranging from 6% to 9% of all couplesFootnote 6
In 2017, nearly 1.5 million Canadians aged 25 to 64 were in couple relationships where they lived in separate households from their partners. The number of people living apart from their partners increased from 6% of all couples in 2006 to 9% in 2017. This arrangement remained most common among younger adults, accounting for 20% of individuals aged 25 to 34 in 2001 and in 2017. The most common reasons these individuals gave for living apart from their partners in 2017 were circumstances (51%), a choice they made (34%) or that they had never considered living together (15%). These reasons are consistent with findings from 2011 (42%, 32%, and 17%, respectively).
In 2021, lone-parent families accounted for over one-quarter of all couples with children, a 10% increase from 2011Footnote 7
The number of lone-parent families increased by 10% from 1.5 million in 2011 to 1.7 million in 2021. Despite this increase, the proportion of lone-parent families remained relatively stable, representing 27% of all census families with children in 2011 and 28% in 2021 (see Table 1). While couple families with children continued to represent a larger proportion of all census families with children (73% in 2011 and 72% in 2021), the number of lone-parent families grew at a higher proportional rate (+10%) than couple families with children (+4%) between 2011 and 2021. When looking at children specifically, in 2021, 2.6 million children in census families lived with a lone parent (25%), while 8 million children lived in two-parent families (75%).Footnote 8
In 2011, mother-headed families accounted for 79% (1.2 million) of lone-parent families, while fathers headed the remaining 21% (327,545). This trend continued in 2021, with mothers heading 77% (1.3 million) of lone-parent families. However, the number of male-led lone-parent families increased by 17% between 2001 and 2021 (383,670 in 2021), while the number of female-led lone-parent families increased at a smaller proportional rate (+9%) over the same period.Footnote 9
While the proportion of stepfamilies remained stable between 2011 and 2015, ranging from 12% to 15%, family composition changedFootnote 10
In 2021, just over one in ten couples with children (12%) were stepfamilies, meaning a family with at least one biological or adopted child whose birth preceded the current union (see Table 2). The overall prevalence was similar in 2011 (12%). Similarly, stepfamilies continued to be four times more likely to live in common-law relationships (35% in 2011 and 31% in 2021) as opposed to being married (8% and 7%). The composition of stepfamilies remained stable over the last decade. In 2011, there were 194,010 stepfamilies with children from both partners and/or from the current relationship (38%) and 188,735 in 2021 (37%), while the proportion of stepfamilies with children belonging to only one partner remained largely unchanged (62% and 63%).
Stepfamily prevalence also differed by couple type in 2021. Among couples with children, stepfamilies represented a higher proportion of same gender couples (39%) than different gender couples (12%), transgender couples (16%) and non-binary couples (22%).
The number of multigenerational households increased 21% since the early 2000sFootnote 11
Multigenerational households, defined as households where three or more generations live together, have increased steadily in Canada over the past two decades. The number of these households rose from 364,505 in 2001 to 441,750 in 2021, representing a 21% increase (see Table 3). This growth outpaced the overall increase in private households over the same period (+12%). Despite these increases, multigenerational households continued to represent a small proportion of private households (3% in 2011 and 2021).Footnote 12 By 2021, approximately 2.4 million people lived in multigenerational households, including nearly one in ten children (905,000). While the rise in multigenerational living has occurred alongside higher housing costs and broader cost-of-living pressures, these households were also less likely to experience low income, at 4% compared with 15% among other households in 2020. Cultural and demographic characteristics may also contribute to the prevalence of multigenerational families, as more than half of individuals in these households were racialized (53%), and 41% were born outside Canada in 2021.
While the proportion of young adults who live at home with their parents increased since 2001, it has remained stable since 2016Footnote 13
Intergenerational living, where adult children aged 20 and older continue to live at home with their parents without grandparents, became increasingly common alongside the rise in multigenerational households. In 2021, this arrangement accounted for 7.1 million people, representing approximately one-fifth (20%) of people living in private households. Intergenerational living was particularly prevalent among young adults aged 20 to 34. While the proportion living with at least one of their parents increased from 31% in 2001, the proportion of young adults living with their parents remained stable between 2016 and 2021 (35%). However, the proportion of young adults living with their parents increased in older age groups; 38% of adults aged 25 to 34 lived with their parents in 2001 compared to the 46% in 2021. Adult children living at home had lower employment rates (ranging from 58% to 69% depending on their age) than those living in other households (66% to 82%). For those aged 20 to 24, the differences in employment (59% of those living at home versus 66% in other households) may be, in part, due to the higher proportion of adult children living at home attending post-secondary education (58% versus 44%). In contrast, parents who were retirement-aged and had adult children living at home in 2021 had higher employment rates (e.g., 58% of parents aged 60 to 64) compared to retirement-aged parents living in other households (49%).
As the average age of mothers at childbirth continued to increase in 2022, the lowest fertility rate was recordedFootnote 14
Over the last century, the average census family size in Canada declined steadily from 4.2 persons in 1931 to 2.9 persons in 2021, reflecting a long-term shift toward smaller families.Footnote 15 Alongside declining family sizes, there have been changes in the fertility rate. Canada’s fertility rate has generally declined for the last 15 years, reaching a new all-time low of 1.25 children per woman in 2024. In contrast, the fertility rate was 3.48 children per woman in 1921 (see Figure 2). This decline accelerated recently, dropping 7% between 2021 and 2022, the largest single-year decrease observed since the baby bust of 1971-1972 (-8%). Not all populations experienced this national decline, however. Fertility rates in 2024 remained higher than the national rate (1.25) in Nunavut (2.34), the Northwest Territories (1.39), Quebec (1.34) and the Prairie provinces (1.41 in Alberta, 1.58 in Saskatchewan and 1.50 in Manitoba), largely reflecting the demographic patterns of First Nations, Métis and Inuit communities.
In 2022, the average age of mothers at childbirth increased from 26.8 years in 1977 to 31.6 years, while the average age of fathers rose from 30.1 years in 1974 to 34.4 years. At the same time, the proportion of babies born to teenage mothers aged 15 to 19 declined from 6% in 1993 to 1% in 2023. This shift toward older parenthood coincided with changes in birth outcomes. The rate of premature births increased from 7% to 8% between 1993 and 2023, the highest level observed in 50 years. Childlessness also increased, with the proportion of women aged 50 and older with no biological children rising from 14% in 2001 to 17% in 2022. One reason for the rise in childlessness is people’s choice; in 2022, one-third (34%) of people aged 15 to 49 did not intend to have any children.Footnote 16
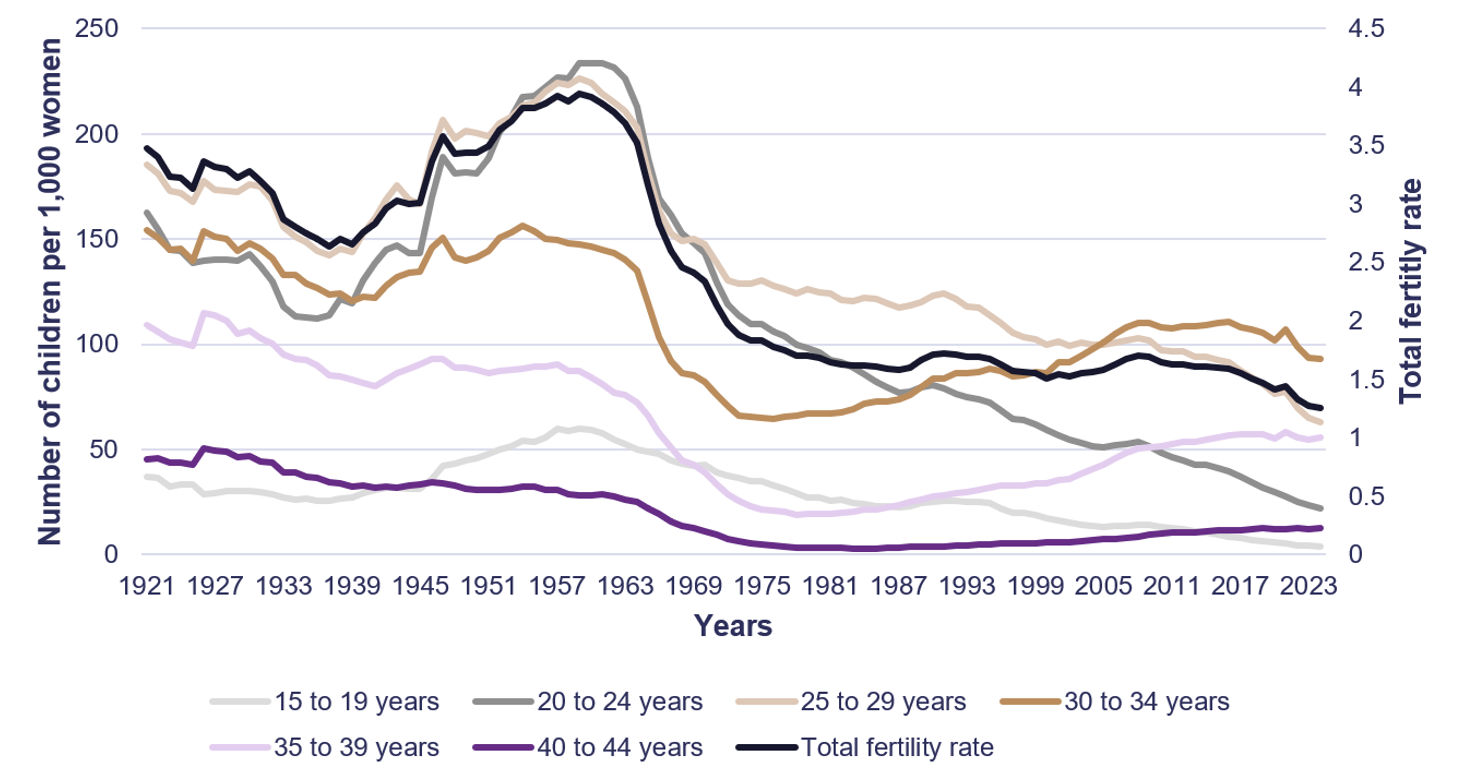
Figure 2. Fertility rate by age group and total fertility rate, Canada, 1921 to 2024
Text version
This line chart titled “Fertility rate by age group and total fertility rate, Canada, 1921 to 2024” shows how fertility rates have changed over time across different age groups, along with the overall total fertility rate. The horizontal axis displays years from 1921 to 2024. The left vertical axis shows the number of children per 1,000 women for each age group, and the right vertical axis shows the total fertility rate (average number of children per woman).
Overall, the chart shows that fertility patterns shifted significantly over time, with much higher birth rates in the mid-20th century, followed by a sharp decline after the 1960s. In recent decades, fertility has shifted toward older age groups, while overall fertility remains low compared to earlier periods.
- For mothers aged 15 to 19 the number of births per 1,000 women remain relatively low, around 30 to 40 in the early decades then a slight increase mid-century before declining steadily to 4 by 2024.
- For mothers aged 20 to 24 the number of births per 1,000 women was the highest in early and mid-century, peaking above 236 around the late 1950s to early 1960s.The number then declines sharply after the the mid-1960s to below 110 by the late 1970s and continues on a gradual decline to around 22 by 2024.
- For mothers aged 25 to 29 the number of births per 1,000 women was also very high in the mid-century, peaking slightly above 226. The number then declines after the 1960s but remains one of the higher age groups into the 1980s before decreasing to just under 63 in 2024.
- For mothers aged 30 to 34 the number of births per 1,000 women was at moderate levels earlier in the century, around 130 to 154 in 1955, then dropping to about 66 in the 1975. The number rises again from the 1980s onward, reaching around 110 by the 2010s before a slight recent decline to just under 93 in 2024.
- For mothers aged 35 to 39 the number of births per 1,000 women starts at 152 in 1921 then declines steadily to 66 by 1974. The number then increases again from the 1980s onward until a slight decreases again in the 2020s to about 55 by 2024
- For mothers aged 40 to 44 the number of births per 1,000 women sayed low throughout the period, starting around 45 in the 1921 then dropping to around 3 in the late 1970s. It gradually increases again to just under 13 by 2024
The Total fertility rate starts at about 3.5 children per woman in the early 1920s, declines during the 1930s, then rises sharply to a peak of around 3.9 by 1962 (the baby boom period). It then drops rapidly after the mid-1960s to below 2.0 by the 1970s. It remains below replacement level (around 2.1) from the 1970s onward reaching close to 1.3 or lower by 2024.
Notes: When the age of the mother was unknown, it was prorated using observed distribution. The data from 2017 exclude Yukon and mothers aged 45 years and older.
Source: Provencher, C. and Galbraith, N. Fertility in Canada, 1921 to 2022. Statistics Canada Catalogue no. 91F0015M; and Statistics Canada. n.d.-e. Fertility indicators, provinces and territories: Interactive dashboard. Catalogue no 71-607-X.
Annex A: Data Tables
| 2021 | 2011 | |||
|---|---|---|---|---|
| Census family structure | Number | Percentage | Number | Percentage |
| Census families | 10,262,925 | 100% | 9,389,695 | 100% |
| Census families with children | 5,976,755 | 58% | 5,637,130 | 60% |
| Total, couple families with children | 4,290,415 | 72% | 4,109,290 | 73% |
| Married couple families with children | 3,481,770 | 81% | 3,402,740 | 83% |
| Common-law couple families with children | 808,640 | 19% | 706,560 | 17% |
| Total, lone-parent families | 1,686,340 | 28% | 1,527,840 | 27% |
| Headed by a woman | 1,302,670 | 77% | 1,200,295 | 79% |
| Headed by a man | 383,670 | 23% | 327,545 | 21% |
Source: Statistics Canada. n.d.-a. Census family structure, presence of children and average number of persons per census family: Canada, provinces and territories, census metropolitan areas and census agglomerations.
| 2021 | 2011 | |||
|---|---|---|---|---|
| Type of stepfamily | Number | Percentage | Number | Percentage |
| Total, married and common-law couple stepfamilies | 503,475 | 100% | 508,705 | 100% |
| Total, simple stepfamilies1 | 314,740 | 63% | 314,690 | 62% |
| Total, complex stepfamilies2 | 188,735 | 37% | 194,010 | 38% |
| Total, married couple stepfamilies | 252,945 | 50% | 261,015 | 51% |
| Married couple families in simple stepfamilies1 | 156,120 | 62% | 153,010 | 59% |
| Married couple families in complex stepfamilies2 | 96,825 | 38% | 108,005 | 41% |
| Total, common-law couple stepfamilies | 250,530 | 50% | 247,690 | 49% |
| Common-law couple families in simple stepfamilies1 | 158,620 | 63% | 161,680 | 65% |
| Common-law couple families in complex stepfamilies2 | 91,910 | 37% | 86,005 | 35% |
Notes: (1) Simple stepfamilies refer to stepfamilies with no step or half siblings, meaning that all children are the biological or adopted children of only one spouse or partner in the couple. (2) Complex stepfamilies are stepfamilies with at least one step or half sibling, where there is at least one child from each spouse or partner in the couple, or there is at least one child of one of the spouses and partners and at least one child of both spouses or partners.
Source: Statistics Canada. n.d.-c. Table 98-10-0124-01 Census family structure including detailed information on stepfamilies, number of children, average number of children and age of youngest child.
| Total, household types | Multigenerational households | ||
|---|---|---|---|
| 2021 | Number | 14,978,940 | 441,750 |
| Percentage | 100% | 3% | |
| 2016 | Number | 14,072,080 | 406,645 |
| Percentage | 100% | 3% | |
| 2011 | Number | 13,320,615 | 364,505 |
| Percentage | 100% | 3% |
Source: Statistics Canada. n.d.-d. Table 98-10-0138-01 Household type including multigenerational households and structural type of dwelling: Canada, provinces and territories, census metropolitan areas and census agglomerations.
J4-197/2026E-PDF
ISBN 978-0-662-29277-7
- Date modified: