
Legal aid plan personnel
Legal aid plans in Canada operate under variations of three service delivery models: the staff lawyer model, the judicare model and the mixed model. In the staff lawyer model, lawyers providing legal aid services are employed directly by legal aid plans. In the judicare model, legal services are provided by lawyers in private practice who are paid by the legal aid plan based on tariff rates. The mixed model uses a combination of staff and private lawyers to provide legal aid services. The following section of the report provides information on the service delivery models at legal aid plans by detailing the type of staff working in legal aid, and cases they work on. This includes information on both lawyers and non-lawyers.
At the national level, legal aid services are delivered primarily by private bar lawyers
Table 17 provides an overview of the proportion of staff lawyers versus private bar lawyers delivering legal aid services across the country. While these data provide a picture of the number of lawyers providing services, these figures do not reflect the differences between the legal aid case loads of private bar versus staff lawyers. In some cases, a legal aid plan may have a higher proportion of private bar lawyers, but the staff lawyers at that plan may be managing a higher proportion of cases. Over the past five years, the proportion of staff lawyers versus private bar lawyers delivering legal aid services has remained consistent.
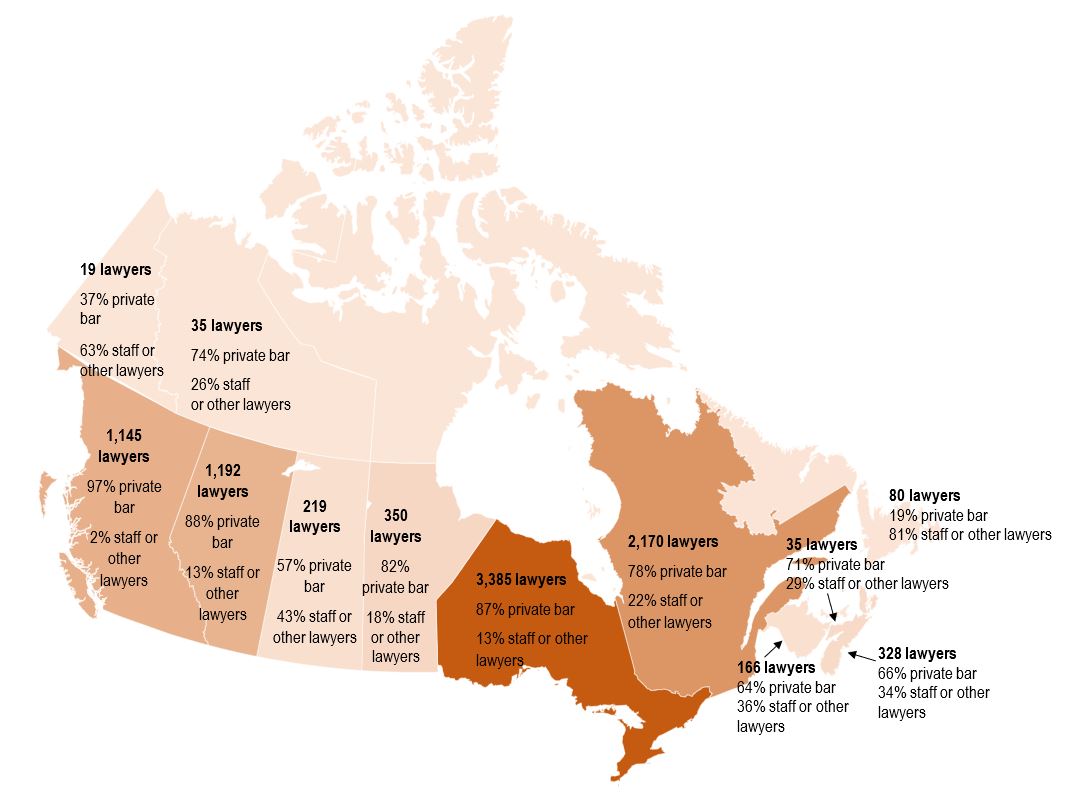
Figure 21 depicts the service delivery models of legal aid plans across the country. Overall, just over 6 in 10 of the 9,124 lawyers providing legal aid services in Canada were in Ontario (37%) and Quebec (24%). When looking at the breakdown between private and staff lawyers within each province/territory, British Columbia and Alberta had the highest proportions of private bar lawyers (97% and 88%, respectively), while Newfoundland and Labrador and Yukon had the highest proportions of staff and other lawyers (81% and 63%, respectively) (Figure 21).
Figure 21
The legal aid plans located in the Atlantic provinces, Saskatchewan, and Yukon operate predominantly under a staff lawyer service delivery model.
Text version
This is a map chart of Canada with text in all provinces/territories (apart from Nunavut). The map has gradient orange colouring with provinces/territories with the highest proportion of lawyers having the darkest colouring.
Starting from top left going to bottom right the text on the map is as follows: Yukon has 19 lawyers, 37% private bar, 63% staff or other lawyers; Northwest Territories has 35 lawyers, 74% private bar, 26% staff or other lawyers; British Columbia has 1,145 lawyers, 97% private bar, 2% staff or other lawyers; Alberta has 1,192 lawyers, 88% private bar, 13% staff or other lawyers; Saskatchewan has 29 lawyers, 57% private bar, 43% staff or other lawyers; Manitoba has 350 lawyers, 82% private bar, 18% staff or other lawyers; Ontario has 3,385 lawyers, 87% private bar, 13% staff or other lawyers; Quebec has 2,170 lawyers, 78% private bar, 22% staff or other lawyers; New Brunswick has 166 lawyers, 64% private bar, 36% staff or other lawyers; Prince Edward Island has 35 lawyers, 71% private bar, 29% staff or other lawyers; Nova Scotia has 328 lawyers, 66% private bar, 34% staff or other lawyers; Newfoundland and Labrador has 80 lawyers, 19% private bar, 81% staff or other lawyers.
Source: Table 17 - Legal aid service delivery by private bar, staff, and other lawyers, 2023-24.
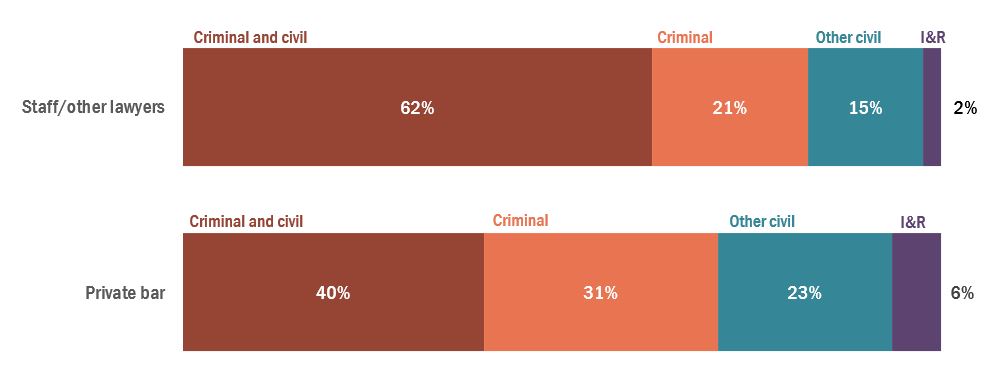
In 2023-24, 83% of the 9,124 lawyers providing legal aid services in Canada were private bar lawyers (Table 17). Staff lawyers made up 15% of lawyers providing direct legal aid services to clients, and other lawyers (such as Executive Directors) made up 2%. In 2023-24, among private bar lawyers, 40% provided both criminal and civil law services. There were more private bar lawyers providing only criminal legal aid services as compared to only civil (31% and 23%, respectively), while 6% of private bar lawyers provided legal aid services for I&R matters. Of the staff lawyers and other lawyers, the highest proportion provided both criminal and civil law services (62%), while 21% provided only criminal services and 15% provided only civil law services. The remaining 2% provided services for I&R matters (Figure 22).
Figure 22
Most lawyers delivering legal aid services provide both civil and criminal services, and this is particularly true for staff lawyers where close to two thirds provide both types of services.
Text version
This is a horizontal stacked bar graph with two bars. The top bar represents staff/other lawyers, and the bottom bar represents private bar lawyers. The overall graphic represents the type of legal matters handled by different types of lawyers delivering legal aid services.
The top bar has four portions broken down for staff/other lawyers, with criminal and civil services taking up the majority at 62% coloured in dark orange. Criminal services take up 21% in medium orange, other civil takes up 15% in turquoise and I&R takes up 2% in purple.
The bottom bar has four portions broken down for private bar lawyers, with criminal and civil services taking up the majority at 40% coloured in dark orange. Criminal services take up 31% in medium orange, other civil takes up 23% in turquoise and I&R takes up 6% in purple.
Source: Table 17 - Legal aid service delivery by private bar, staff, and other lawyers, 2023-24.
Non-lawyers made up 19% of legal aid plan personnel
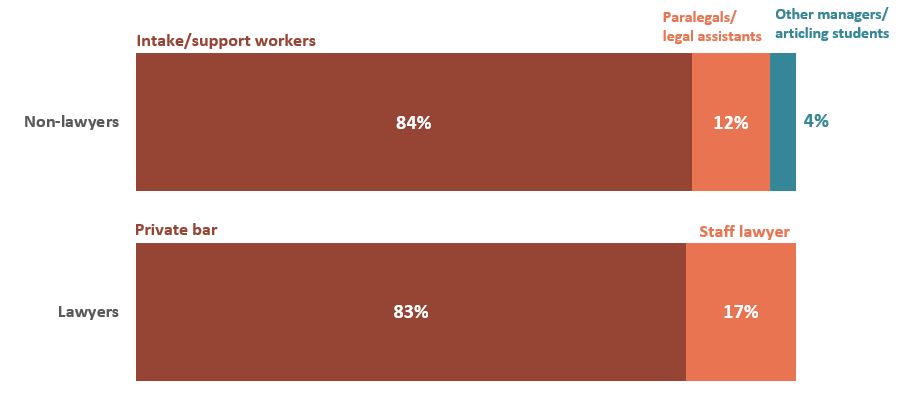
Legal aid plans employ a variety of non-lawyer personnel to support the delivery of legal aid services to clients. Over the past five years the proportions of various legal aid plan personnel have remained relatively stable. In 2023-24, lawyers made up 81% of legal aid plan personnel and non-lawyers made up the other 19% (Table 18). Of the 2,181 non-lawyers working for legal aid plans, intake workers/support staff (84%) were most common, followed by paralegals/legal assistants (12%), and articling students/other (i.e., managers) (4%) made up the remaining non-lawyer personnel (Figure 23).
Figure 23
Legal aid plan personnel include a variety of staff, with intake/support workers making up the largest cohort outside of the private bar.
Text version
This is a horizontal stacked bar graph with two bars. The top bar represents non-lawyers, and the bottom bar represents lawyers. The overall graphic represents distribution of legal aid personnel as of March 31, 2024.
The top bar has three portions, with intake/support workers taking up the majority at 84% colored in dark orange. Paralegals/legal assistants take up 12% in medium orange, and other managers/articling students take up the last 4% in turquoise.
The bottom bar has two portions, with private bar lawyers taking up 84% colored in dark orange. The remaining 16% is taken up by staff lawyers colored in medium orange.
Source: Table 18 - Legal aid personnel as of March 31, 2024.
- Date modified: