
Legal aid applications
A legal aid application is a request for legal aid assistance. An application can result in either a client receiving summary or full legal representation, or the denial of legal aid service. Summary services include the provision of legal advice, information, or any other type of minimal legal service granted to an individual, while full legal representation constitutes more extensive legal assistance. The total number of applications reported for the fiscal year includes all applications filed during that time, irrespective of when the application was approved or rejected.
In this report, an application for legal aid is counted as approved only for those clients that receive full legal representation. Also, the total number of applications reflects the number of individual requests for assistance, rather than the total number of persons seeking assistance. Once an application is approved for full legal representation by the legal aid plan, the certificate may then be sent to a private bar lawyer who bills the legal aid plan, or the service may be provided by a legal aid staff lawyer.Footnote 10
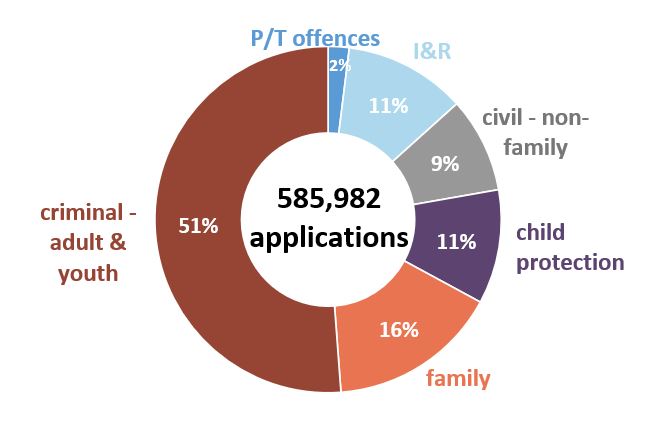
Over 585,000 legal aid applications were received in 2023-24
The number of applications for legal aid reflects the total number of requests for assistance, rather than the total number of persons seeking assistance. This means that a single individual could file multiple applications, or in the case of I&R, one application could include multiple applicants if it represents a family. In 2023-24 there were 585,982 legal aid applications received. Just over half (51%) were for criminal matters (adult and youth), while 47% were for civil matters (16% family, 11% child protection, 9% civil non-familyFootnote 11, and 11% I&R), and 2% for P/T offences (Figure 3).
Of the 299,934 applications for criminal legal aid, 93% were from adults and 7% were from youth. Out of the 274,550 civil applications, the highest proportion were for family matters (34%), followed by I&R (24%), child protection (23%), and non-family matters (e.g., landlord and tenant disputes, poverty law) (19%) (Table 3). The proportion of applications for I&R matters has increased over the past several years, increasing by 68% between 2022-23 and 2023-24.Footnote 12 This increase is attributed to the additional funding to address increased demand for I&R legal aid services in recent years.
Figure 3
Criminal matters made up just over half of the 585,982 legal aid applications received in 2023-24.
Text version
Figure 3 is a pie chart with seven categories with individual corresponding colors, and in the center, it reads “585,982 applications” indicating total applications. Going from the largest portion to the smallest it reads as follows:
Criminal- adult & youth, which take up 51% of the chart and is colored in dark orange. Family takes up 16% of the chart, child protection at 11%, civil-non-family at 9%, immigration and refugee (I&R) at 11%, and finally P/T offences at 2%.
Source: Table 3 - Legal aid applications received, by type of matter, 2023-24.
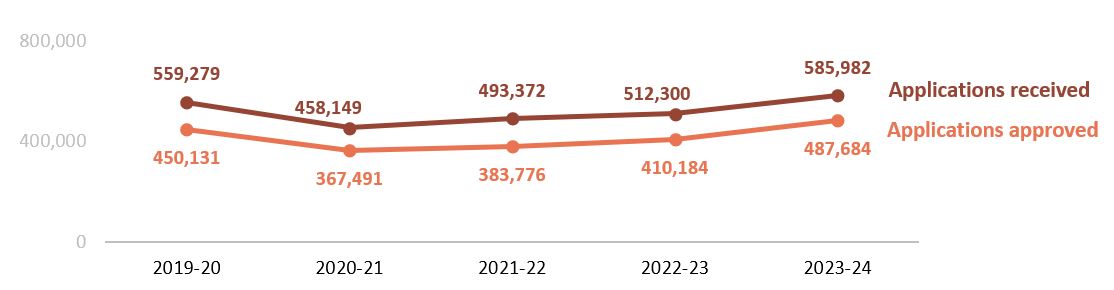
Figure 4 shows the trends in legal aid applications received and approved over the past five years. The number of applications received and approved reached a low during the pandemic, and they have both trended upwards since 2020-21. In 2023-24, the number of received applications was up by 14% from 2022-23, while the number of approved applications was up 19%. Compared to 2019-20, applications have surpassed pre-pandemic levels up 5% for received applications and 8% for approved applications.
Figure 4
In 2023-24 the number of legal aid applications received was up 14% from the previous year, and surpassed pre-pandemic levels by 4% compared to 2019-20.
Text version
There is a trend line graph with two lines indicating the numbers of applications received on a fiscal yearly basis from 2019-2020 to 2023-2024. The top line is in dark orange and indicates applications received, while the bottom line is in a medium orange indicating applications approved. There are five year markers for each line signified by a dot and a number.
For 2019-2020 the top line indicates 559,279 applications received, while the bottom line indicates 450,131 of those were approved. For 2020-2021 the top line notes 458,149 applications received, and the bottom line states 367,491 of those were approved. For 2021-2022 the top line indicates 493,372 total applications received, with the bottom line showing that 383,776 of those were approved. In 2022-2023 the top line states there were 512,300 applications received, with the bottom line noting that 410,184 of those were approved. The final time period of 2023-2024 shows 585,982 applications received via the top line, and the bottom line indicates 487,684 of those were approved.
Source: Table 3 - Legal aid applications received, by type of matter, 2019-20 to 2023-24; and Table 4 - Legal aid applications approved for full legal representation, by staff and private bar lawyers, 2019-20 to 2023-24.
Quebec received the most applications at 232,299, which accounted for 40% of all applications received nationally in 2023-24. Ontario and Alberta were the next two provinces that received the most applications (26% and 10% respectively). The breakdown between criminal and civil applications within each province and territory shows that Prince Edward Island (79%), Yukon (79%), Alberta (75%) had the highest proportion of criminal applications compared to civil. Quebec (55%), Ontario (53%), and New Brunswick (44%) had the highest proportion of civil applications among the jurisdictions (Table 3).
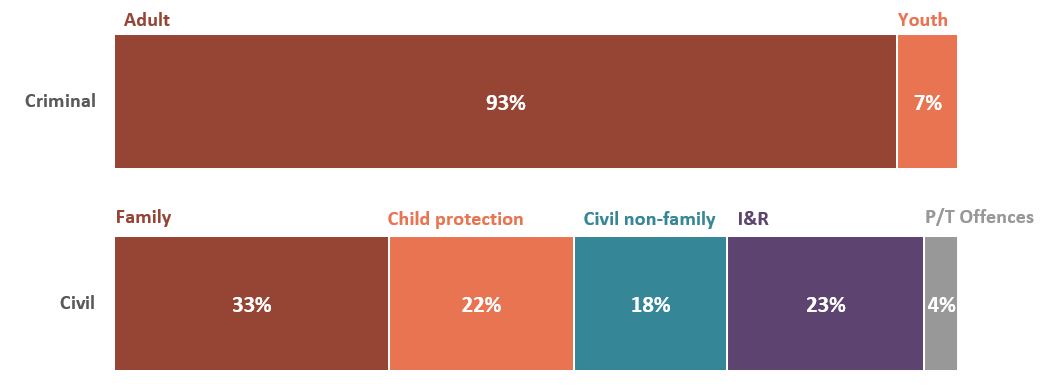
Figure 5 shows the breakdown between adult versus youth cases for criminal legal aid matters, as well as the breakdown between different categories of civil matters. Consistent with previous years, criminal matters were most often related to adults (93% versus 7% for youth matters). For civil matters, 2023-24 saw a higher proportion of civil matters for I&R compared to previous years, up to 23% of civil matters compared to only 7% in 2022-23.Footnote 13 This increase can be attributed to the increase in demand in recent years.
Figure 5
In 2023-24 the number of legal aid applications received was up 14% from the previous year, surpassing pre-pandemic levels by 4% compared to 2019-20.
Text version
There are two horizontal bar charts displaying the type of legal aid applications received by type. The top bar displays criminal matters, while the lower bar displays civil matters.
The top bar only has two portions, with the larger portion being adult criminal matters taking up 93% and is colored in dark orange, while the youth criminal matters take up the remaining 7% and is coloured in a medium orange.
The bottom bar has 5 portions, it reads as follows going form the largest portion to the smallest: Family takes up 33% and is colored in dark orange, child protection takes up 22% and is colored in a medium orange, civil non-family takes up 18% and is colored in turquoise, immigration and refugee (I&R) takes up 23% and is colored in purple, and the last 4% is covered by PT offences which is colored in a grey.
Source: Table 3 - Legal aid applications received, by type of matter, 2023-24.
Application approvals
More than eight in ten legal aid applications received were approved for full legal representation
In 2023-24, out of the 585,982 legal aid applications received (Table 3), 487,684 applications, or 83%, were approved for full representation. This approval rate is up 4% from the previous year, and up 3% when compared to 2019-20 where 80% of applications were approved.
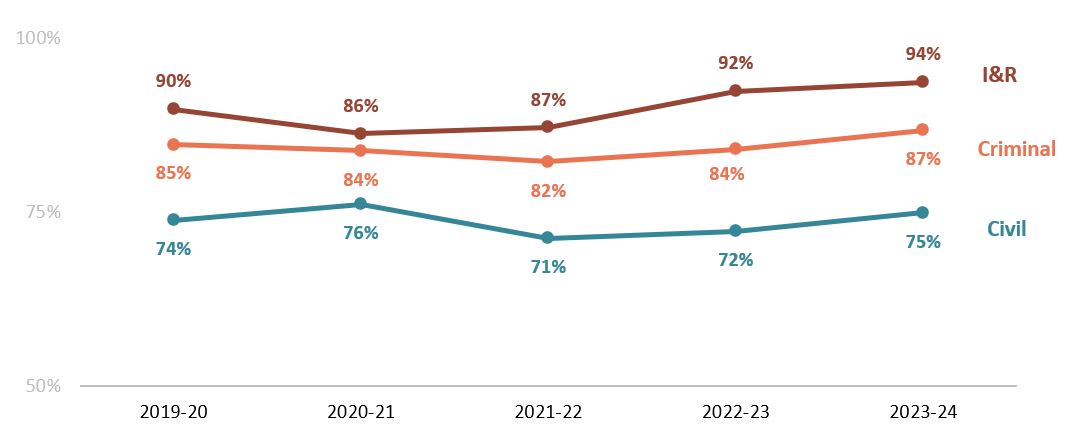
Figure 6 shows the variation in approval rates by application type over the past five years. Immigration and refugee matters had the highest approval rates at 94% in 2023-24, like the previous year. The approval rates for other civil applications (i.e., child protection, family, and civil non-family matters) were the lowest, with three-quarters (75%) of applications approved in 2023-24. Application approvals for criminal legal aid increased to 87% in 2023-24 from 84% in 2022-23, the highest rate over the past five years.
Figure 6
Application approval rates have mostly been stable over time, however in 2023-24 approval rates for all application types continued a slight upwards trend.
Text version
There is a horizontal trendline plot that indicates the approval rate for legal representation applications. Within the graph there are three lines over a five-year period from 2019-20 to 2023-24, with each yearly period being indicated by a small dot. The top line is in dark orange and indicates immigration and refugee (I&R) matters, the middle line is in a medium orange and indicates criminal matters, while the bottom line is in turquoise and indicates other civil matters.
At the first dot which represents the 2019-2020 period, the top line has a 90% rate, the middle 85% and the bottom line with 74%. For the 2020-2021 period, the top line reads 86%, the middle reads 84%, and the last reads 76%. For the 2021-22 period the top line reads 87%, the middle reads 82%, and the last reads 71%. For the 2022-23 period the top line reads 92%, the middle reads 84%, and the last reads 72%. For the 2023-24 period the top line reads 94%, the middle reads 87%, and the last reads 75%.
Source: Table 3 - Legal aid applications received by type of matter, 2019-20 to 2023-24; and Table 4 - Legal aid applications approved for full legal representation, by staff and private bar lawyers, 2019-20 to 2023-24.
Of the applications approved for full representation in 2023-24, more than half (53%) were for criminal legal aid, 45% were for civil legal aid (including I&R), and the remainder (2%) for provincial/territorial offences. Of the approved criminal applications, the majority (92%) were for adult matters, and 8% were for youth matters. For civil matters, 27% were for family matters, 26% were for child protection matters, and 18% were for non-family related matters. I&R matters made up 29% of approved civil applications in the provinces where I&R legal aid services are available (Table 4).
When looking at differences in the proportions of approved applications by province/territory and type of matter, differences may be attributable to a variety of factors including differences in approval rates between criminal matters, or differences in the types of services requested/provided. In 2023-24 Prince Edward Island had the highest proportion of approved applications that were criminal as opposed to civil (88% versus 12%). Quebec had the highest proportion of civil applications approved compared with criminal, with 55% of civil and 41% of criminal legal aid applications approved for full legal representation (Table 4).
There are around 500 legal clinics across the country with differing levels of services offered. Ontario has the most developed system of community legal clinics which are funded by Legal Aid Ontario and operate independently. The level and amount of assistance provided by a legal clinic may vary depending on the type of clinic and legal problem (for example, most clinics focus on non-criminal matters). Generally, clinics will help clients identify Public Legal Education and Information (PLEI) materials, or provide limited (e.g., 30 min) legal information or advice. In some cases, clinic staff can make referrals to legal aid or (depending on the focus of the clinic) private counsel. Footnote 14 Footnote 15 In Ontario, there were 2,591 adult and 190 youth applications managed by legal clinics, which made up less than 1% of total approved criminal applications in the province in 2023-24.
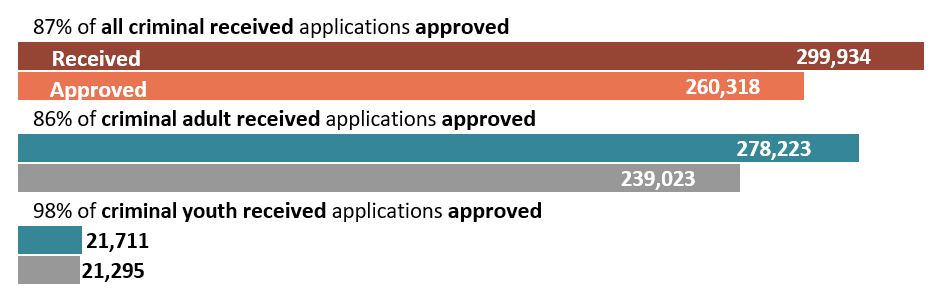
Figures 7 to 9 show the approval rates of applications broken down by type of matter. Figure 7 shows that criminal youth applications had the highest rate of approval, with 98% of received applications approved. Most youth applications are approved because of the eligibility criteria set out in the Canada-Province contribution agreements, which gives priority to youth.
Criminal adult applications were approved at a rate just above the average approval rate of all applications (83%), at 86%. The overall approval rate for criminal applications, both adult and youth was 87% (Figure 7).
Figure 7
Eighty-six percent of adult criminal applications were approved; while almost all youth criminal applications were approved due to eligibility criteria that prioritizes youth.
Text version
There is a horizontal bar chart with three sets of bars showing the number and percentages of applications that were received and approved for full legal representation by type of matter in 2023-2024. There are three different categories representing types of matter going from top to bottom: criminal applications, criminal-adult applications, and criminal-youth applications. Each bar has two categories, the top bar represents the received applications, and the bottom bar represents the applications that were approved for full legal representation.
The first category shows that 87% of all received criminal applications were approved. The first bar in this category is dark orange and shows that there was a total of 299,934 received applications. The second bar is dark light purple and shows that 260,318 of these applications were approved.
The second category shows that 86% of received adult criminal applications were approved. The first bar in this category is turquoise and shows that there was a total of 278,223 received applications. The second bar is grey and shows that 239,023 of these applications were approved.
The third category shows that 98% of received criminal-youth applications were approved. The first bar in this category is turquoise and shows that there was a total of 21,711 received applications. The second bar is grey and shows that 21,295 of these applications were approved.
Source: Table 3 - Legal aid applications received by type of matter, 2023-24; and Table 4 - Legal aid applications approved for full legal representation, by staff and private bar lawyers, 2023-24.
Legal aid applications for I&R matters had an approval rate higher than the overall average, at 94%, while P/T offence applications were approved at a rate just below the overall average, at 79% (Figure 8).
Figure 8
Applications for immigration and refugee matters had an approval rate higher than other types of matters, with 94% of applications approved.
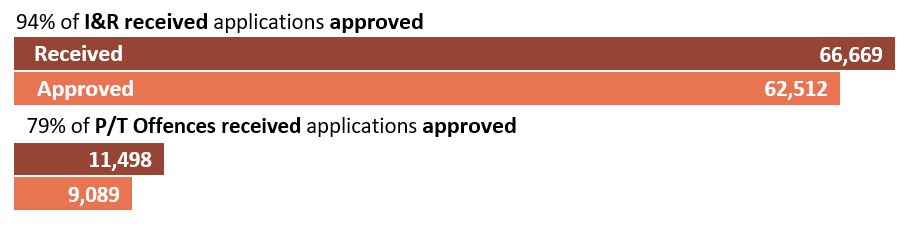
Text version
There is a horizontal bar chart showing the number and percentages of applications that were approved for full legal representation by type of matter in 2023-2024. There are two different categories representing types of matter: immigration and refugee (I&R) and P/T. Each bar has two categories, the top bar represents the received applications, and the bottom bar represents the applications that were approved for full legal representation.
The first category shows that 94% of all received immigration and refugee (I&R) applications were approved. The first bar in this category is dark orange and shows that there were a total of 66,669 received applications. The second bar is medium orange and shows that 65,512 of these applications were approved.
The second category shows that 79% of all received P/T applications were approved. The first bar in this category is dark orange and shows that there was a total of 11,498 received applications. The second bar is medium orange and shows that 9,089 of these applications were approved.
Source: Table 3 - Legal aid applications received, by type of matter, 2023-24; and Table 4 - Legal aid applications approved for full legal representation, by staff and private bar lawyers, 2023-24.
For other civil legal aid applications (Figure 9), child protection matters had the highest rate of approval (91%) followed by civil-non family applications (76%) and family applications (64%).
Figure 9
Applications for child protection matters had the highest rate of approval among other civil matters, with just over 9 in 10 approved.
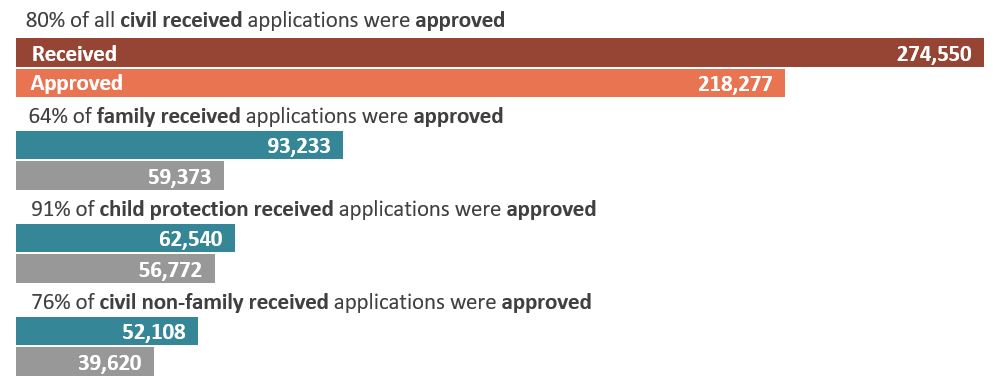
Text version
There is a horizontal bar chart with four sets of bars showing the number and percentages of applications that were approved for full legal representation by type of matter in 2023-2024. There are four different categories representing types of matter going from top to bottom: All civil applications, family applications, child protection applications, and civil non-family applications. Each bar has two categories, the top bar represents the received applications, and the bottom bar represents the applications that were approved for full legal representation.
The first category shows that 80% of all received civil applications were approved. The first bar in this category is dark purple and shows that there was a total of 274,550 received applications. The second bar is dark light purple and shows that 218,277 of these applications were approved.
The second category shows that 64% of received family applications were approved. The first bar in this category is light green and shows that there was a total of 93,233 received applications. The second bar is grey and shows that 59,772 of these applications were approved.
The third category shows that 91% of received child protection applications were approved. The first bar in this category is light green and shows that there was a total of 62,540 received applications. The second bar is grey and shows that 56,772 of these applications were approved.
The fourth and final category shows that 76% of received civil non-family applications were approved. The first bar in this category is light green and shows that there was a total of 52,108 received applications. The second bar is grey and shows that 39,620 of these applications were approved.
Source: Table 3 – Legal aid applications received, by type of matter, 2023-24; and Table 4 – Legal aid applications approved for full legal representation, by staff and private bar lawyers, 2023-24.
Application refusals
Financial eligibility was the most common reason for application refusal
Refused applications include applications for which no services have been approved, as well as those applications denied for full legal representation that subsequently received summary services. In 2023-24, of the 80,230 applications (both criminal and civil) where a reason for refusal was reported, half (49%) were refused for financial eligibility. Financial eligibility refusal is based on financial information (e.g., income level, assets, liabilities) disclosed by the applicant that shows they do not meet the financial eligibility requirements set by the legal aid plan and therefore do not qualify for legal aid. Financial eligibility criteria are set out by each legal aid plan and therefore the criteria differ across the provinces and territories. The next most common reasons for refusal were “other reasons” for refusal and “coverage restrictions” (27% and 18%, respectively). Coverage restriction refusals are applications refused on the grounds that the legal matter is not covered by the legal aid plan. For example, some plans do not cover wills and estates or workplace injury claims (Table 5).
When looking at the breakdown of reasons for refusal by P/T, Prince Edward Island (90%) and Yukon (87%) had the highest proportions of applications refused for financial eligibility. Ontario (32%) and New Brunswick (31%) had the highest proportions of applications refused for coverage restrictions (Table 5).
Figure 10 shows the trends in legal aid application reasons for refusal over the past five years. In 2023-24 the proportion of applications refused for financial eligibility was down to 49% from 60% the previous year. Over the same time the proportion of applications refused for other reasons increased by a similar proportion (from 20% to 27%). Coverage restriction refusals decreased between 2019-20 and 2021-22 to a low of 13% but have since trended upwards and were up to 18% in 2023-24.
Figure 10
The proportion of legal aid applications refused for financial eligibility continued a downward trend in 2023-24, while other refusal categories increased slightly.
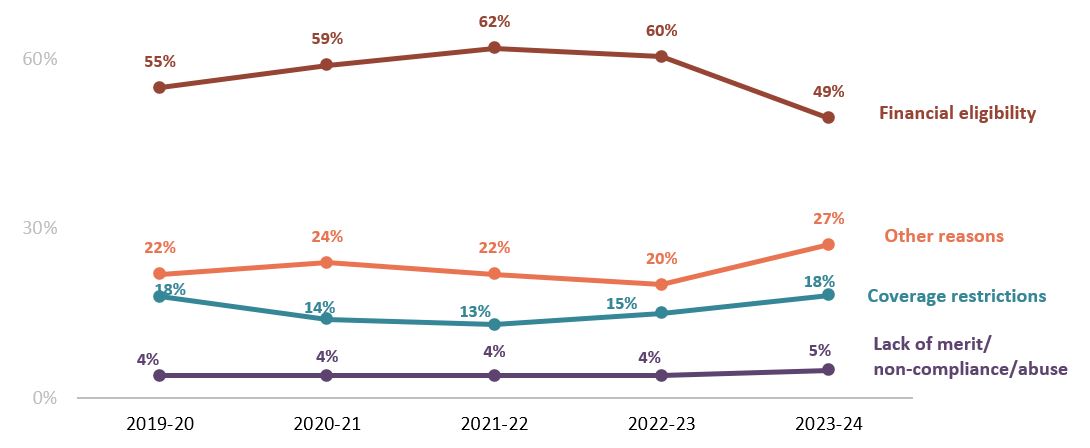
Text version
There is a horizontal trendline graph showing percentages of refused legal aid applications by reason for refusal for all types of legal matters. There are 4 different horizontal lines shown in this graph that spans a five year period from 2019-20 – 2023-24. The first line is dark orange and represents financial ineligibility; The second line is medium orange and represents other reasons; The third line is turquoise and represents coverage restrictions; The fourth line is purple and represents lack of merit/non-compliance/abuse.
Results from 2019-2020 and shows that 55% of applicants were denied due to financial ineligibility, 22% due to other reasons, 18% had coverage restrictions and 4% were denied due to lack of merit/non-compliance/abuse.
In 2020-2021 results show 59% of applicants were denied due to financial ineligibility, 24% due to other reasons, 14% had coverage restrictions and 4% were denied due to lack of merit/non-compliance/abuse.
In 2021-2022, 62% of applicants were denied due to financial ineligibility, 22% due to other reasons, 13% had coverage restrictions and 4% were denied due to lack of merit/non-compliance/abuse.
In 2022-2023, 60% of applicants were denied due to financial ineligibility, 20% due to other reasons, 15% had coverage restrictions and 4% were denied due to lack of merit/non-compliance/abuse.
In 2023-2024, 49% of applicants were denied due to financial ineligibility, 27% due to other reasons, 18% had coverage restrictions and 5% were denied due to lack of merit/non-compliance/abuse.
Source: Table 5 - Refused legal aid applications, by reason for refusal, all legal aid matters, 2019-20 to 2023-24.
Just under half of refused criminal legal aid applications were refused for financial eligibility
Looking at criminal legal aid applications, financial eligibility was the most common reason for refusal (47%), followed by other reasons (35%) and coverage restrictions at 15% (Table 6). By province and territory, Prince Edward Island had the highest proportion of financial eligibility refusals (100%), and Ontario had the highest proportion of coverage restriction refusals (42%), while lack of merit refusals were highest in Yukon (11%). An application refused for lack of merit is refused because the nature of the case or seriousness of the matter is deemed to not warrant legal assistance and includes criteria such as the type of legal problem and the merit of the case. Nova Scotia had the highest rate of refusal of all jurisdictions for non-compliance or abuse, at 20%, while all other jurisdictions had a rate of 4% or lower. Non-compliance or abuse refusals include cases where similar services were already rendered, services applied for are abusive of the legal process, or because the client fails to co-operate with the legal aid lawyer.
Table 7 shows refused civil and I&R applications by reasons for refusal. For civil and I&R matters, 52% of all applications were refused for financial eligibility, and 20% were refused under coverage restrictions. Yukon and Ontario had the highest proportions of other civil applications refused for financial eligibility (88% and 75%, respectively). Manitoba had the highest proportion of other civil applications refused for coverage restrictions (23%), and for lack of merit (23%). For I&R applications, Quebec had the highest proportion refused for financial eligibility (81%), British Columbia had the highest proportion refused for coverage restrictions (37%), and Newfoundland and Labrador had the highest proportion of lack of merit refusals (29%) (Table 7).
Application outcomes among Indigenous clients
The approval rate of applications for full legal representation from self-identified Indigenous clients was slightly higher than the general application approval rate in 2023-24
Figure 11 shows the number and proportions of applications received and approved for full legal representation from individuals who self-identified as Indigenous in the provinces and territories that collect these data (Table 8). Of the 58,118 applications received from individuals who self-identified as Indigenous for all matters in 2023-24, 86% were approved: a rate slightly higher than the general approval rate of 82% (excluding I&R).
Figure 11
Just under 9 in 10 self-identified Indigenous clients were approved for criminal legal aid.
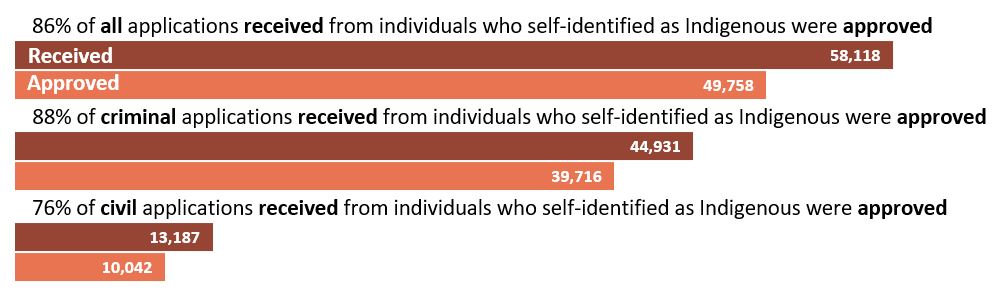
Text version
There is a horizontal bar chart showing the number and percentages of applications for legal aid from self-identified Indigenous clients that were approved for full legal representation by type of matter in 2023-2024. There are three different categories representing type of matter going from top to bottom: all applications received, criminal applications and civil applications for Indigenous clients. Each bar has two categories, the top bar represents the received applications, and the bottom bar represents the applications that were approved for full legal representation.
The first category shows that 86% of all applications received from individuals who self-identified as Indigenous were approved. The first bar in this category is dark orange and shows that there was a total of 58,118 received applications. The second bar is medium orange and shows that 49,770 of these applications were approved.
The second category shows that 88% of all criminal applications received from individuals who self-identified as Indigenous were approved. The first bar in this category is dark orange and shows that there was a total of 44,931 received applications. The second bar is medium orange and shows that 39,716 of these applications were approved.
The third category shows that 76% of all civil applications received from individuals who self-identified as Indigenous were approved. The first bar in this category is dark orange and shows that there was a total of 13,187 received applications. The second bar is medium orange and shows that 10,042 of these applications were approved.
Source: Table 8 - Applications for full legal representation, approved and refused, by self-identified Indigenous population, criminal and civil, and province/territory, 2023-24.
- Date modified: