
Cases and expenditures
Tables 14 and 15 show adult and youth criminal legal aid cases that were approved for full legal representation, and incurred expenditures in 2023-24, in addition to cases that were ongoing from previous years and incurred expenditures in 2023-24. These are broken down by general offence categories, as well as the proportion of in-year expenditures dedicated to each offence category. Note that the offence categories do not refer to specific offences under the Criminal Code. Rather, they represent groupings of similar offence types.
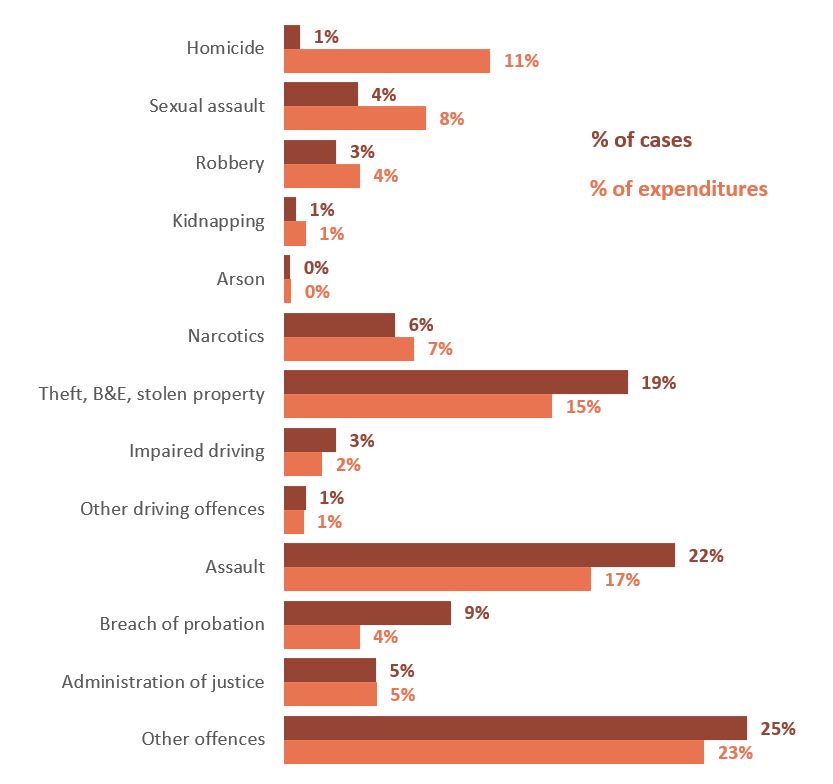
Assault was the most frequent offence category, with the highest proportion of in-year expenditures for adult criminal legal aid
Excluding the category of other offences, assault made up the highest proportion of both in-year expenditures at 17% and case volume at 22% in 2023-24. The next most common offence category was theft, break and enter, possession of stolen property (19% of case volume and 15% of in-year expenditures) (Figure 18).
Figure 18 shows that there were a few categories of offences that made up a very small proportion of case volumes, but a comparatively higher proportion of in-year expenditures. This included homicide, which accounted for 1% of cases, but 11% of in-year expenditures, and sexual assault, which made up 4% of case volume and 8% of expenditures. The reverse is true for breach of probation offences, which made up a high proportion of case volume (9%), but a relatively low proportion of expenditures (4%).
Figure 18
For adult criminal cases, homicides and sexual assault cases had disproportionately high case expenditures in relation to case volume.
Text version
This a clustered bar chart. The vertical axis on the left lists offence categories: homicide, sexual assault, robbery, kidnapping, arson, narcotics, theft/B&E/stolen property, impaired driving, other driving offences, assault, breach of probation, administration of justice, and other offences.
The legend indicates that the dark orange bars represent “% of cases” while the medium orange bar represents “% of expenditures”.
The bars start at homicide where the dark orange bar is 1% and the medium orange bar is 11%.
At sexual assault, the dark orange bar is at 4% while the medium orange bar is at 8%.
At robbery, the dark orange bar is at 3% while the medium orange bar is at 4%.
At kidnapping, both bars converge at 1%.
At arson, both bars are at 0%.
At narcotics, the dark orange bar is at 6% and the medium orange bar is at 7%.
At theft, B&E, stolen property, the dark orange bar is at 19% and the medium orange bar is at 15%.
At impaired driving, the dark orange bar is at 3% and the medium orange is at 2%.
At other driving offences, both bars are at 1%.
At assault, the dark orange bar is at 22% and the medium orange bar is at 17%.
At breach of probation, the dark orange bar is 9% and the medium orange bar is 4%.
At administration of justice, both bars are at 5%
At other offences, the dark orange bar is at 25% and the medium orange bar is at 23%.
Source: Table 14 - Adult criminal legal aid by percentage of cases and percentage of in-year expenditures, Canada, 2023-24 (excluding appeals, mental disorder and Extradition Act cases).
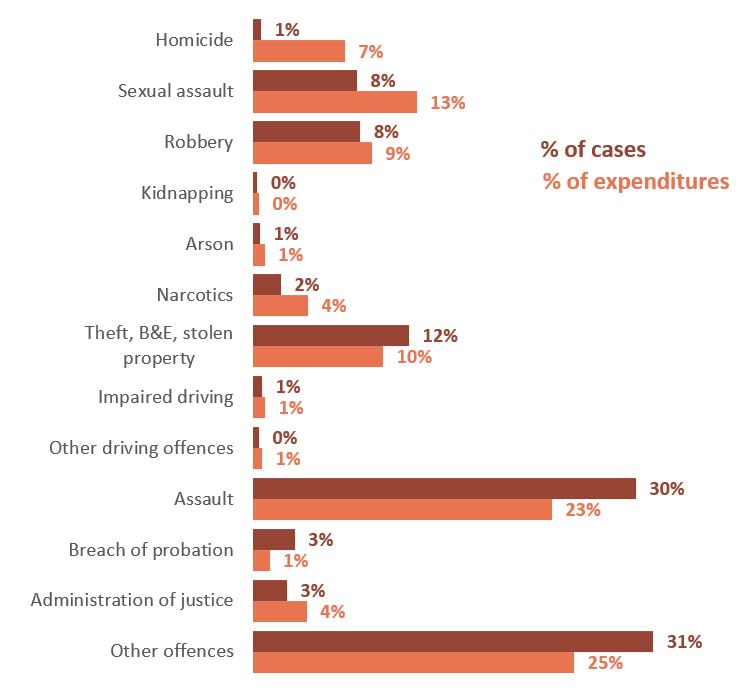
Assault was the most frequent offence category for youth, with the highest proportion of in-year expenditures for youth criminal legal aid
Figure 19 shows that the case volume (proportion of cases) is largely in line with expenditures for youth offences, and the differences for youth cases are very similar to adults. Excluding other offences, assault made up the highest proportion of case volume (30%) and the highest proportion of in-year expenditures (23%) in 2023-24. Theft, break and enter, possession of stolen property and sexual assault were the next two most common offence categories with 12% and 8% of case volumes respectively. Expenditures reflect the differing levels of complexity of cases, with theft, break and enter, possession of stolen property expenditures at 10% while sexual assault expenditures were at 13% of in-year expenditures.
Like adult cases, homicide offences made up a very small proportion of case volume, but a comparatively higher proportion of in-year expenditures, accounting for 1% of cases but 7% of in-year expenditures.
Figure 19
For youth criminal cases, homicides had disproportionately high case expenditures in relation to case volume while assaults had the opposite variance.
Text version
This a clustered bar chart. The vertical axis on the left lists offence categories: homicide, sexual assault, robbery, kidnapping, arson, narcotics, theft/B&E/stolen property, impaired driving, other driving offences, assault, breach of probation, administration of justice, and other offences.
The legend indicates that the dark orange bars represent “% of cases” while the medium orange bar represents “% of expenditures”.
The bars start at homicide where the dark orange bar is 1% and the medium orange bar is 7%.
At sexual assault, the dark orange bar is at 8% while the medium orange bar is at 13%.
At robbery, the dark orange bar is at 8% while the medium orange bar is at 9%.
At kidnapping, both bars are at 0%.
At arson, both bars are at 1%.
At narcotics, the dark orange bar is at 2% and the medium orange bar is at 4%.
At theft, B&E, stolen property, the dark orange bar is at 12% and the medium orange bar is at 10%.
At impaired driving, both bars are at 1%.
At other driving offences, the dark orange bar is at 0% and the medium orange bar is at 1%.
At assault, the dark orange bar is at 30% and the medium orange bar is at 23%.
At breach of probation, the dark orange bar is 3% and the medium orange bar is 1%.
At administration of justice, the dark orange bar is 3% and the medium orange bar is 4%.
At other offences, the dark orange bar is at 31% and the medium orange bar is at 25%.
Source: Table 15 - Youth criminal legal aid by percentage of cases and percentage of in-year expenditures, Canada, 2023-24 (excluding appeals, mental disorder and Extradition Act cases).
- Date modified: